Basit Zafar, Max Livingston, and Wilbert van der Klaauw
One of the direct effects of the 2008 financial crisis on U.S. households was a sharp tightening of credit. Households that had previously been able to borrow relatively freely through credit cards, home equity loans, or personal loans suddenly found those lines closed off—just when they needed them the most. In recent months, aggregate statistics such as the Federal Reserve’s Consumer Credit series and the Senior Loan Officer Opinion Survey have shown a gradual improvement in consumer credit. The former series is an indicator of interaction of credit supply and demand, while the latter shows only short-term changes in demand and supply (as reported by lenders) separately. It is, therefore, not entirely clear whether the observed trends are a result of fluctuations in demand or supply. Are those demanding credit getting it? What differences are there among U.S. consumers in their demand for and access to credit?
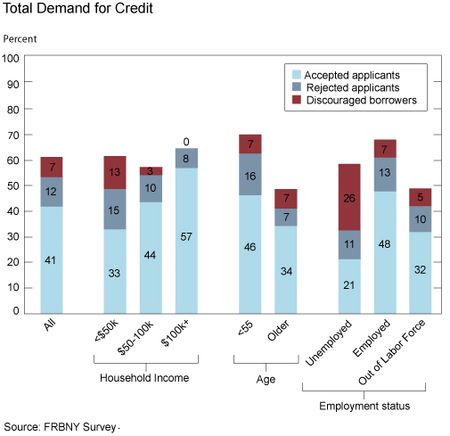
To answer these questions, we designed and included a set of questions on credit access and demand as part of an internet-based survey conducted by the New York Fed. The May survey, administered to 1,375 U.S. households heads, included questions about households’ ability to obtain credit and their expectations about obtaining credit in the future. Fifty-three percent of households reported that they applied for some type of credit in the past twelve months: 41 percent of households applied for credit and were approved (accepted applicants), while 12 percent applied and were rejected (rejected applicants). Besides the 53 percent who applied for credit, an additional 7 percent reported that they needed credit over the past twelve months, but did not apply because they believed they would not be approved. This group of respondents represents latent demand for credit: we refer to them as discouraged borrowers. These three groups of household heads—accepted applicants, rejected applicants, and discouraged borrowers—represent the set of household heads that exhibited demand for credit in the past twelve months; they make up 60 percent of our sample.
Variation in Credit Demand and Outcomes across Households
The first chart (below) shows U.S. households’ demand for credit. We split the sample by various demographic groups. The height of each bar shows the total (expressed and latent) demand exhibited by that group. As we can see, while there is some variation in the demand for credit across demographic groups, the majority of almost every demographic segment demanded credit in the past year. Demand for credit varies between 47 percent for those out of the labor force to 69 percent for the younger household heads (those under the age of 55).
Within each bar, the three kinds of groups—accepted applicants, rejected applicants, discouraged borrowers—are denoted with a different color. Here we can see substantial differences in the composition of the groups. Compare, for example, the lower-income group (those with annual household income below $50,000), and the high-income group (those with annual household income above $100,000). Both groups demanded credit at similar rates: 61 percent of lower-income households and 65 percent of high-income households demanded credit over the past twelve months. But 33 percent of lower-income households were approved (the light blue bar in the figure), while 57 percent of high-income households were approved. Likewise, while 13 percent of the lower-income households were discouraged borrowers (the maroon bar in the figure), only 0.3 percent of the high-income households fell in this category. A similar pattern plays out when comparing unemployed and employed individuals—a larger proportion of unemployed respondents do not apply because they believe they would be rejected, and those who do apply are rejected at a higher rate than the employed.
What Explains the Unmet Demand?
The chart above shows that, overall, 19 percent of households had unmet demand for credit (either they were rejected or were too discouraged to apply). Again, there is substantial heterogeneity in unmet demand: 28 percent of lower-income households had unmet demand, compared with only 8 percent of high-income households. Similarly, 37 percent of the unemployed had unmet demand, compared with 20 percent of the employed.
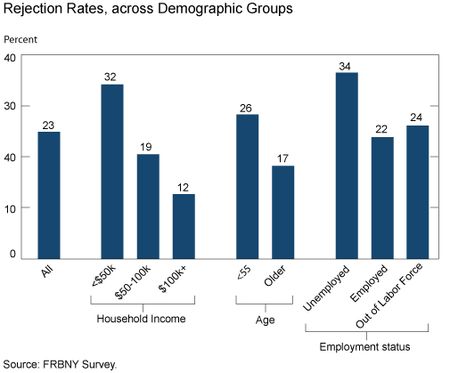
The second chart (below) shows that a partial explanation for the inability of these disadvantaged groups (unemployed, lower-income households) to obtain credit is that they face higher rejection rates. The rejection rate is simply the number of rejected applicants (gray bar in the first chart) divided by the number of total applicants (the gray and light blue bars in the first chart). The overall rejection rate is 23 percent in the sample. This figure compares with a rejection rate of 28 percent in the 2010 Survey of Consumer Finances (SCF), and 25 percent in the 2007 SCF. Note, however, that the SCF rejection rates are computed over a period of five years (as opposed to ours, which is over a one-year period); the 25 percent rate from the 2007 SCF, for example, refers to the period 2003-07. So our data suggest that rejection rates are currently high.
Again, the variation in rejection rates across the demographic groups is striking. The rejection rate for the lower-income group is nearly three times as high as that for the high-income group (32 percent versus 12 percent), and is substantially higher for the unemployed—34 percent versus 22 percent for the employed.
Are Borrowers and Lenders Acting Sensibly?
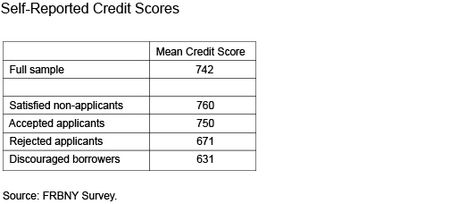
The first chart also shows that the disadvantaged groups—lower-income and unemployed household heads—are more likely to be discouraged. These patterns raise two questions: Are the higher rejection rates of these groups warranted, and is the pool of discouraged borrowers right when they assume they will not get credit? We asked respondents to report their credit scores to help shed some light on this. The first table (below) shows that the average self-reported credit score in our sample is 742; this compares favorably with an average Experian risk score of 736 for the U.S. population.
We can see that the discouraged borrowers have the lowest average credit score. This result suggests that these individuals have poor credit, seem to be aware of it, and are rightly not applying. The table also shows that applicants who are rejected have a significantly lower credit score than those who are accepted (671 versus 750); this again indicates that the credit-worthiness of applicants is a main determinant of their application outcomes.
What Does the Future Hold?
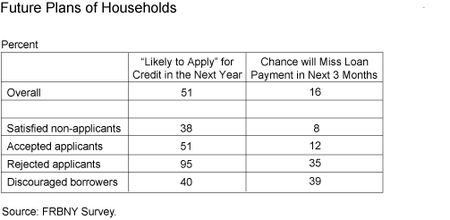
We next look at households’ expectations regarding future credit access and demand. The second table below shows that nearly half of all households are likely to apply for some type of credit over t
he next twelve months. Unsurprisingly, virtually all those who were rejected in the past year are likely to apply for credit in the coming year. Somewhat surprising, though, is that a large proportion of applicants who had applied and been approved in the past year are still likely to apply for more credit in the coming year, suggesting that although they received credit, they anticipate still more demand.
Are the outcomes of households going to be different? We asked households their likelihood (on a scale of 0-100) of missing a loan payment on any existing outstanding debts in the next three months. We see that the average likelihood of being delinquent is 35-40 percent for the rejected applicants and discouraged borrowers—significantly higher than that for their counterparts. That is, households whose demand is not being met are high-risk and seem to be aware of it. This suggests that, in the near term, the credit prospects of such households are unlikely to change. Using our survey, we have been able to determine that currently there is a large amount of unmet demand for credit. In the future, we intend to follow-up on respondents’ ability to obtain credit to see how their actions and perceptions with regard to credit change over time.
 Basit Zafar is an economist in the Federal Reserve Bank of New York’s Research and Statistics Group.
 Max Livingston is a research analyst in the Group.
 Wilbert van der Klaauw is a senior vice president in the Group.


 RSS Feed
 Follow Liberty Street Economics
Michael, Thanks for pointing out the error in an earlier version of the last table. Two rows in the table were in fact swapped. The table has been corrected and reposted.
Surely the last table is wrong? Have the labels perhaps been misplaced?