


J. Benson Durham
The spot term premium is the extra compensation investors require, today, to own long-term as opposed to short-term risk-free debt. The expected term premium is what they anticipate demanding later. Notably, the two don’t necessarily move in the same direction. Just as near-term expected short rates could decline with surprisingly easy monetary policy, while simultaneously more distant-horizon expected rates could increase if that action boosts expected longer-run inflation or growth, so too could investors require less duration compensation immediately, perhaps as the central bank announces plans to buy assets, yet build in greater risk premiums for later amid allowances for a bumpy withdrawal of the punchbowl. Why is this distinction relevant? Nearly everyone agrees that historically low term premiums coincided with unconventional measures, but we know less about how long investors expected low premiums to prevail. Drawing on my staff report, formal models suggest that expected term premiums did drop along with spot measures, but a survey-based estimate notably increased since 2007. This hardly means the Federal Open Market Committee (FOMC) didn’t provide extraordinary support beyond the standard short rate channel, but perhaps investors weren’t insouciant and instead fathomed a possibly tricky exit from prolonged policy accommodation.
This persistence also bears on the real effects of monetary policy, as some studies argue that permanency in rate movements matters—the longer rates stay lower, the greater the economic boost. The same is plausibly true for narrower transmissions through term premiums. So, what are some details on the estimates?
Arbitrage-Free Model-Based Measures of Expected Ten-Year Term Premiums
Decreases in spot term premiums can rarely be “permanent” within the confines of an affine term structure model (ATSM). By construction, the underlying factors are nearly always mean-reverting, so that low spot term premiums—a function of those variables—rebound to historical averages. The big question is how quickly, which is governed by the parameters, in turn typically derived from yield patterns observed over ultimately limited samples that include too few rate cycles.
In the chart below, the black line shows the estimated spot ten-year term premium, and the blue line and red line show the anticipated measure two and five years ahead, respectively, according to a simple three-factor Vasicek model.

Following the familiar story, the spot term premium reached historical lows in 2008:Q4 and again around 2012:Q2. The two-year-ahead expected measure also declined, but not as precipitously, and the five-year-ahead metric barely budged comparatively. Also, judging by the gap between the black and blue lines at these extreme spot lows, investors expected the term premium to recover at least 80 percent of its long-run level within two years.
However, the next chart, based on a more advanced five-factor model from Adrian, Crump, and Moench (2013), tells another story. Given the tight correlation as well as very narrow spreads among the spot, two-year, and five-year estimates, shocks to the term premium appear to take much longer to dissipate, which, in contrast to the simple model, is broadly consistent with considerable persistence in perceived accommodation.

A Simple Survey-Based Measure of Expected Ten-Year Term Premiums
Inferences from the five-factor model are much safer, but perhaps given some inherent limits of any ASTM-based approach, a completely different approach merits a look. To motivate a pure survey-based measure, ponder two questions. First, what three-month Treasury bill rate do you expect in 1,000 years? Second, what will ten-year U.S. Treasury yields be a millennium ahead?
The wisest answer might be none at all, but what would any difference between these two responses represent? The pure expectations hypothesis demands the same answer for both. Millennium-ahead forecasts of bill yields would reflect the perceived equilibrium short rate, and if longer-term rates solely comprise the average expected short rate, then the two responses cannot differ, unless investors anticipate changes in monetary policy between AD 3014 and AD 3024. So, what would a positive spread convey? Respondents could expect their offspring a millennium ahead to violate the pure expectations hypothesis and to demand compensation for rolling over shorter-term debt to the U.S. Treasury. The difference in long-run forecasts might, then, capture expected term premiums.
No existing survey poses such questions, but twice a year the Blue Chip Financial Forecasts (BCFF) includes forecasts for the federal funds rate, three- and six-month bill rates, and one-, two-, five-, ten-, and thirty-year nominal yields between six and ten years ahead. Ten years is not a millennium, but these data might imply an assumption about perceived equilibriums as opposed to near-term cycles. The BCFF also includes forecasts for each year between one and five years hence. So, if the mean forecast for the federal funds rate for the fifth year is equal to the average forecast for the sixth through the tenth year, then a reasonable inference is that respondents expect no cyclical developments after the fifth year, and thus the longest-horizon forecast indeed closely resembles an equilibrium projection.
Some evidence suggests as much. For example, the expected funds rate for 2019 in the June 2013 survey was 3.9 percent, 310 basis points greater than for 2015, but also 10 basis points greater than the 3.8 percent forecast for 2020 through 2024, which implies no further “normalization” beyond five years. Besides this observation, given twenty-eight of the thirty-two surveys since December 1996, the projected federal funds rate for the fifth year ahead is within 10 basis points of the average expected federal funds rate between six and ten years ahead, and the outliers simply don’t reflect instances where near-term forecasts bled into longer-run projections.
Turning to expected term premiums, two dimensions of the surface given all BCFF responses are noteworthy. First, the expected yield curve six to ten years ahead is always upward sloping—even the anticipated spread between six and three months bills is always positive, as it is between any adjacent point. Thus, unless investors from December 1996 through June 2013 consistently expected the Federal Reserve to be tightening policy between six and ten years hence, this slope suggests positive expected term premiums.
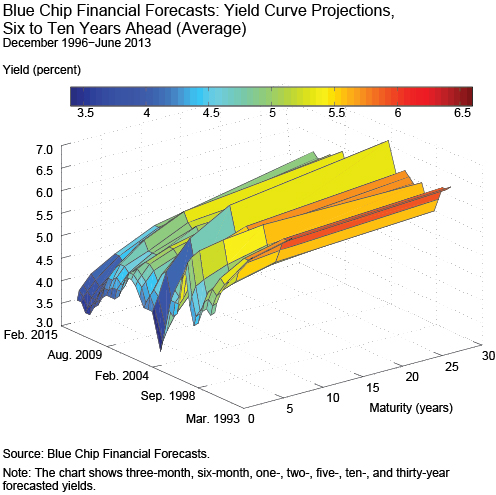
Second, the level and slope of the projected average term structures vary over time, which might reflect changes in forecasted risk preferences. Such variation at a particular point along the term structure approximates the expected ten-year term premium. The solid black line in the following chart shows the forecasted average ten-year yield, the dashed black line is the projected three-month bill rate, and the red line is the corresponding spread, the expected ten-year term premium proxy. In short, whereas a number of spot-survey-based estimates declined, this measure increased on net since 2007, remained above average through the mid-2013 rates selloff, and tellingly correlated with investors’ uncertainty about short rates, as detailed in my staff report.

Discussion
Again, these survey-based results do not imply that the Federal Reserve wasn’t accommodative. Instead, they simply address whether market participants anticipated eventual shifts in financial conditions, apart from expected short rates. These inferences may echo my post last month on equity premiums. The recent upward-sloping term structure of required stock returns suggests investors became increasingly less comfortable with shares the longer the horizon, a forecast period that not implausibly includes expectations of an unwind of substantial accommodation.
Disclaimer
The views expressed in this post are those of the author and do not necessarily reflect the position of the Federal Reserve Bank of New York or the Federal Reserve System. Any errors or omissions are the responsibility of the author.

J. Benson Durham is an assistant vice president in the Federal Reserve Bank of New York’s Markets Group.
 RSS Feed
 Follow Liberty Street Economics