Andrew F. Haughwout, Donghoon Lee, Joelle Scally, and
Wilbert van der Klaauw
Today, the New York Fed released the Quarterly Report on Household Debt and Credit for the second quarter of 2014. Aggregate debt was relatively flat in the second quarter as housing-related debt shrank, held down by sluggish mortgage originations. But non-housing debt balances increased across the board, with especially strong gains in auto loans. Auto loan balances, which include leases, have increased for thirteen straight quarters, and originations have not been this high since the third quarter of 2006. The Quarterly Report and the following analysis are based on data from the New York Fed’s Consumer Credit Panel, a nationally representative sample drawn from anonymized Equifax credit data.
Once again, news reports are pointing to a boom in subprime auto lending, and the concerns raised by such a boom and its associated risks have prompted a Justice Department investigation. Last year, amid similar stories, we published the post “Who Is Driving the Auto Lending Recovery?” which showed that 23 percent of auto loans were originated by borrowers with credit scores below 620. This share, though significant, is still lower than the 25 to 30 percent share seen during the years preceding the Great Recession. We’ve now revisited these statistics, and find again that the share has increased only slightly since 2010 (see our interactive charts).
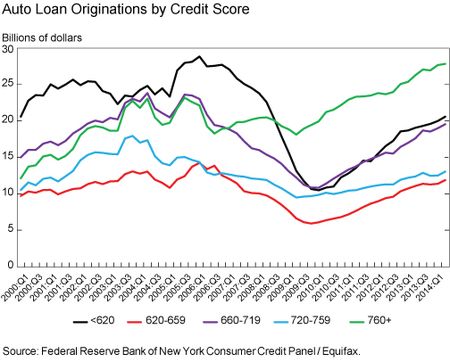
So what has all the fuss been about? The small increase in the share masks the fact that the subprime auto lending market has grown substantially over the last several years, as the chart below shows.
Since the trough in 2009:Q4, balances have risen across the board, but the growth has been most pronounced among the riskier groups, which also experienced the most severe contraction during the credit crunch of 2007-09. The dollar value of originations to people with credit scores below 660 has roughly doubled since 2009, while originations for the other credit score groups increased by only about half. These gains in origination volumes reflect an increase in the average size of the loans more than an increase in the number of loans.
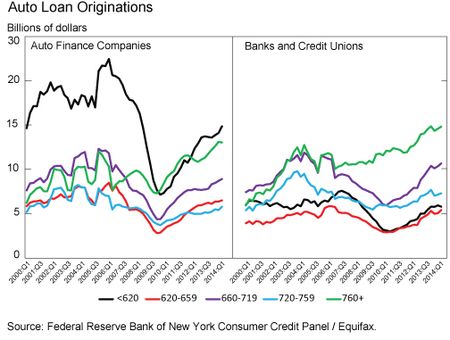
One advantage of our data is the fact that we can infer whether a particular auto loan was made by a bank (including credit unions) or an auto finance company, typically affiliated with a car manufacturer. The two segments are roughly equal in size: in 2014:Q2, auto finance companies originated 53.7 percent of the new loan balances. The chart below shows the breakdown of lending by these two sources of funds. The left panel shows that auto finance companies’ lending to subprime borrowers was hit very hard by the crisis: between mid-2006 and the end of 2009, originations to the below-620 group fell by more than two-thirds. Conversely, in the recovery, subprime lending by auto finance companies has shown considerable strength: since the trough, auto finance company lending to each of the three lowest credit score groups has more than doubled. In contrast, the right panel shows that banks’ lending to subprime borrowers has historically been lower than that to prime borrowers, and despite the increase in recent subprime originations, the share of subprime borrowers remains small. This difference in risk appetite between banks and finance companies is reflected in delinquency rates; while the quarterly flow into thirty-day delinquency for bank loans has been about 1 percent in recent years, it was about 2.5 percent for loans by auto finance companies.
So, subprime auto lending is definitely on the rise in absolute terms, although the increase in prime auto lending over the same period makes the relative increase in the subprime share less pronounced. This resurgence in subprime loans is stronger among auto finance loans, where subprime lending is—and always has been—more prevalent than bank loans. We will continue to monitor this ongoing change in the consumer lending market.
Disclaimer
The views expressed in this post are those of the authors and do not necessarily reflect the position of the Federal Reserve Bank of New York, or the Federal Reserve System. Any errors or omissions are the responsibility of the authors.

Andrew F. Haughwout is a vice president in the Federal Reserve Bank of New York’s Research and Statistics Group.

Donghoon Lee is a senior economist in the Bank’s Research and Statistics Group.

Joelle Scally is a research associate in the Bank’s Research and Statistics Group.

Wilbert van der Klaauw is a senior vice president in the Bank’s Research and Statistics Group.


 RSS Feed
 Follow Liberty Street Economics
Thanks for the comments on our post. Unfortunately our data don’t include the information required to address either question raised here. First of all, we don’t know anything about banks’ (or any other institutions’) exposures to these loans. Some of these are likely sitting in the originator’s portfolios while others are securitized and resold. Our data don’t speak to this issue, or other forms of credit to auto dealers, at all. Similarly, while we agree that borrower credit score alone is an imperfect measure of credit quality on a given loan, we don’t have data on some of the other features that Patrick points to. Surely, though, they will be important in the performance of these loans.
Understanding both the level and concentration of risky assets is, no doubt, important. It is worth noting that a FICO a measure of risk (alone), particularly in the lower spectrum of the score range is not a very good measure of risk. Below 620 the equivalence of a confidence interval is very wide as predictive power erodes. Further, loan structure, particularly in auto, becomes increasingly influential in both probability of default (PD) and loss given default (LGD). As an example, it is generally possible to halve or double the PD estimate just by skewing the Loan to Value relationship within the normal market range. (Implication: there is no PD estimate for a given for a given FICO score absent, of other critical information) Especially in collateralized lending, we cannot meaningfully categorize risk based only on the attributes of the borrower. We must consider the borrower, loan structure, and environment together. While it is convenient to classify risk by a single, generic, credit report-based metric it is not particularly meaningful. Given large consumer lender banks utilize Advanced Methods for modeling, it would be good to see quartile distributions of PD & LGD by loan product made part of the call reporting process. Presumably these models are being independently validated and, at least to some degree, integrated with stress testing. That should translate into significantly more meaningful risk measurements than are achievable with broad FICO splits alone.
How much additional exposure do commercial banks have to subprime paper from financing non-captive finance companies and bridge loans to fund asset-backed securities? Also, should dealer inventory and real estate financed by banks be included in looking at total auto industry exposure to banks? Maybe those categories are immaterial to the direct consumer exposure.