Rod Garratt, Antoine Martin, and James J. McAndrews
The Fedwire® Funds Service is a large-value payment system, operated by the Federal Reserve Bank of New York, that facilitates more than $3 trillion a day in payments. Turnover in Fedwire Funds, the value of payments made for every dollar of liquidity provided, has dropped nearly 75 percent since the crisis. Should we be concerned? In this post, we explain why turnover has dropped so much and argue that it is, in fact, a good thing.
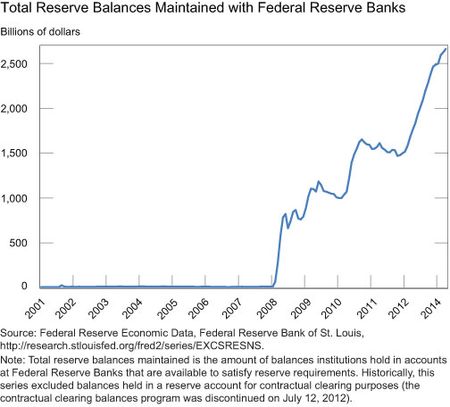
For several years leading up to the crisis, the key factors affecting the funding of payments in Fedwire Funds were relatively constant. Reserves held by banks in Federal Reserve accounts were flat at around $10 billion (see chart below), and the daily interest charged to banks for overdrafts remained fixed at an annualized rate of 36 basis points. However, things started to change in October 2008, when the Fed began to pay interest on reserves (IOR) and increased the supply of reserves to support financial stability.
The supply of reserves is currently $2.6 trillion. These reserves are held by depository institutions, which we will call banks for simplicity, and are available to make payments using the Fedwire Funds Service. The increase in the supply of reserves has led to a major change in the funding composition of payments.
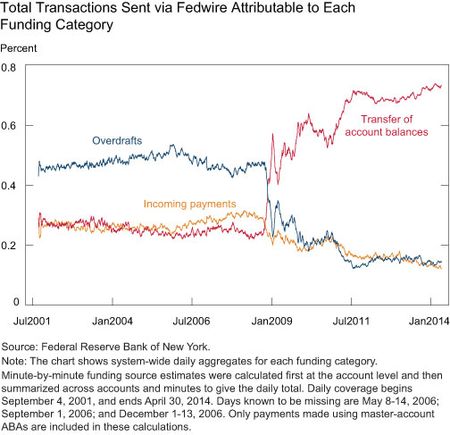
The funding for payments made by banks through Fedwire Funds can be decomposed into three sources: incoming payments, own account balances, and overdrafts (see McAndrews and Rajan). Incoming payments are defined as the source when incoming funds are used to make outgoing payments within the same minute. Outgoing payments in excess of incoming payments are defined to come from the banks’ own account balances, if available. Any outgoing payments in excess of existing account balances are funded using overdrafts. An overdraft is an intraday loan from the Fed to the bank, and interest is assessed on a minute-to-minute basis. Overdrafts are granted automatically for most banks, but are subject to a cap.
Before the crisis, reserve holdings were low, and, consequently, close to half of the payments (by value) processed through the Fedwire Funds payment system were funded by overdrafts. The other half was funded in roughly equal parts by account balances and recycled liquidity from incoming payments. The chart below shows the composition of funding sources for payments in Fedwire Funds from July 2001 through April 2014. Since the build-up in reserves began back in 2008, there has been a large shift away from overdrafts and incoming payments and toward funding payments using own account balances. The proportion of payments funded by overdrafts has fallen significantly in percentage terms and in terms of value.
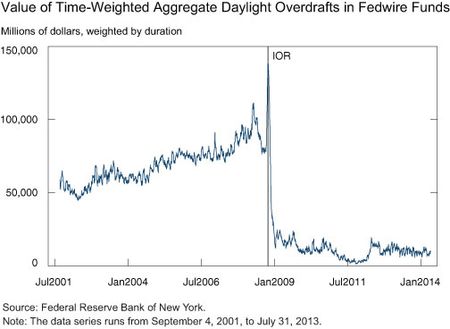
The chart below shows values of aggregate daylight overdrafts over the same period. The value of daylight overdrafts fell precipitously following the increase in the level of excess reserves and the implementation of the IOR policy in October 2008 from pre-crisis levels around $100 billion to less than $10 billion.
Overdafts, Liquidity Usage, and Turnover
The shift in funding away from overdrafts and toward account balances has significantly increased the amount of liquidity needed to fund payments in Fedwire Funds. The reason for this increase is that overdrafts draw liquidity from a common liquidity pool and, therefore, economize on aggregate liquidity usage.
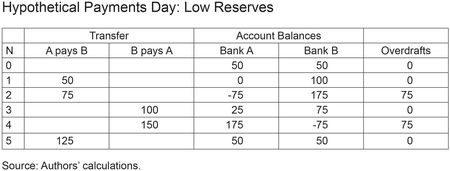
Consider a hypothetical “payments day” involving two banks and five transfers shown in the table below. Each bank starts the day with 50 in their respective reserve accounts. The first payment lowers Bank A’s balance from 50 to 0 and raises Bank B’s balance from 50 to 100. The second payment lowers Bank A’s balance from 0 to -75 and raises Bank B’s balance from 100 to 175, and so on. Over the course of the day, each bank reaches a maximum debit position of 75 (reflected as an account balance of -75 in the table). These liquidity shortfalls are provided by the Federal Reserve in the form of overdrafts, as shown in the column on the far right.
Since the overdrafts occur at different times and because Bank A’s overdraft disappears before Bank B’s arises, the total liquidity that has to be provided by the Fed to fund the overdrafts is only 75. The total liquidity provided by each bank is 50 and hence the total liquidity provided to make the payments in the table below is 175. Since the total value of payments is 500, this means the turnover (the value of payments made divided by total liquidity provided) is 2.86, that is, each $1 of liquidity provided funded $2.86 worth of payments.
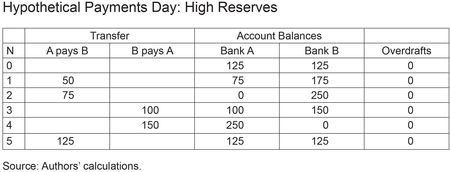
Now imagine banks held higher reserves, as shown in the table below. Note that we have given each bank an opening account balance that is just sufficient to complete their day’s payments (in the same order) without overdrafts.
The total liquidity provided to make the payments i
n is 250: 125 from each bank, and 0 from the Federal Reserve. The turnover rate has now fallen to 2. So the point is, when banks stop using overdrafts, the total amount of liquidity required to complete the day’s payments increases because they no longer take advantage of the gains that come from the use of a common liquidity pool.
Turnover in Fedwire Funds
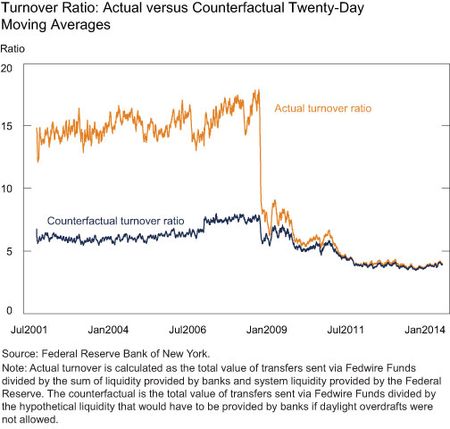
Actual turnover for Fedwire Funds is shown by the gold line in the chart below. Before reserve balances swelled and banks received IOR, banks funded around 50 percent of their payments by value using overdrafts, and each $1 of liquidity funded around $15 worth of payments; turnover was 15. Following the increase in reserves, turnover fell significantly, eventually stabilizing at a level close to 4.
We can see how this drop relates to the reduction in overdrafts by considering a counterfactual scenario in which each bank’s liquidity provision is equal to the difference between its opening balance and its minimum account balance across the day. In reality, a bank’s liquidity provision is capped by the amount of its opening balance. This gives us a counterfactual turnover that corresponds to the case where banks hold sufficient liquidity to make their payments without overdrafts. The result is shown by the blue line in the chart below.
Since overdrafts did not fall to zero following IOR, it is perhaps surprising that the actual turnover ratio (shown in gold) and the hypothetical turnover without overdrafts (shown in blue) so closely coincide in recent years. This implies that an additional reduction in turnover occurred that cannot be attributed to the reduction in overdrafts. We attribute the additional reduction in turnover to a drop in payment coordination, which is reflected in the decrease in the funding of payments by means of incoming payments, shown in the gold line in the second chart to this post.
But It’s Okay
A high turnover ratio is typically viewed as a good thing in a payment system, because more payments can be made with less liquidity. To do more with less is good when resources are scarce. However, reserves don’t have to be scarce. With interest on reserves, the Fed can implement monetary policy even though banks are flush with cash (as we noted in this Economic Policy Review article). And because banks have less need to economize on liquidity, payments are made earlier in the day, which benefits consumers and increases the resiliency of the system to operational outages or participant failures. So the large decrease in turnover should be viewed as a good thing; it is another symptom of how the high level of reserves benefits the payment system.
Disclaimer
The views expressed in this post are those of the authors and do not necessarily reflect the position of the Federal Reserve Bank of New York or the Federal Reserve System. Any errors or omissions are the responsibility of the authors.

Rod Garratt is a vice president in the Federal Reserve Bank of New York’s Research and Statistics Group.

Antoine Martin is a vice president in the Bank’s Research and Statistics Group.

James J. McAndrews is an executive vice president and the director of research at the Federal Reserve Bank of New York.


 RSS Feed
 Follow Liberty Street Economics