People disagree, and so do the members of the Federal Open Market Committee (FOMC). How much do they disagree? Why do they disagree? We look at the FOMC’s projections of the federal funds rate (FFR) and other variables and compare them with those in the New York Fed’s Survey of Primary Dealers (SPD). We show that the members of the FOMC tend to disagree more than the primary dealers and offer some potential explanations.
The Dots
In January 2012, the FOMC began reporting participants’ FFR projections in the Summary of Economic Projections (SEP). Market participants colloquially refer to these projections as “the dots” (see the second chart on page 3 of the September 2014 SEP for an example). In particular, the dispersion of the dots represents disagreement among FOMC members about the future path of the policy rate. The most important aspect to consider when interpreting the dots is that they reflect the individual view of each FOMC participant on the appropriate path of the FFR. That is, they are not forecasts, but policy recommendations. If the dot chart does not reflect each participant’s forecast, then why do they seem to disagree? The most apparent reason is that each participant can have a different assessment of economic conditions that might call for different prescriptions for current and future monetary policy. For example, one FOMC participant indicated the long-run unemployment rate is 6 percent in the September 2014 SEP, suggesting that with the current unemployment rate at 6.1 percent, the economy is close to full employment. As a result, participants judging that the economy is near full employment may view current policy as too accommodative, and therefore prefer a tighter path for policy going forward. Alternatively, another participant saw the longer-run unemployment rate equal to 5 percent, suggesting substantial slack remains, and would thus likely prescribe an easier path. Ultimately, all participants are aiming for an inflation rate of 2 percent and full employment in the long run, though their policy prescriptions to achieve these objectives may look quite different.
Another reason FOMC interest-rate projections may differ is that participants may use different models to formulate their views of future economic conditions, and hence, the appropriate policy. Different models will suggest different paths for the FFR in returning the economy to full employment and inflation to the 2 percent goal. In addition, participants may put different weight on deviations of inflation from the 2 percent goal or unemployment from its long-run level. While achieving these objectives is a goal of every participant in the long run, some may prefer to calibrate policy in a way that returns one of the targets to its goal more quickly than the other. Some participants may even prefer to overshoot one variable to accelerate the pace at which the other variable approaches its long-run level. Other considerations that may affect views on the appropriate path of policy are more difficult to quantify. For example, risk assessments and financial stability concerns often factor into views on appropriate policy. Finally, participants’ views also differ on factors affecting the FFR’s longer-run value, such as the economy’s potential growth rate.
With all this in mind, how do we judge the amount of disagreement in FOMC projections? One useful benchmark is to look at disagreement among professional forecasters, specifically those who contribute to the SPD.
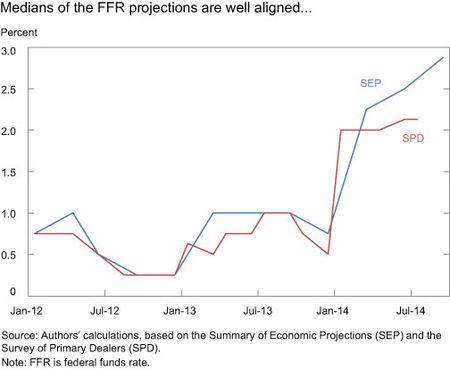
In contrast to the FOMC projections, private-sector forecasts generally focus on the most likely policy outcomes at FOMC meetings rather than on ongoing policy prescriptions. Despite the potentially different objectives, the chart below shows that the median of the FFR projections from the SEP and SPD forecasts two years out are quite similar (the September SPD will not be released to the public until October).
Agreeing to Disagree
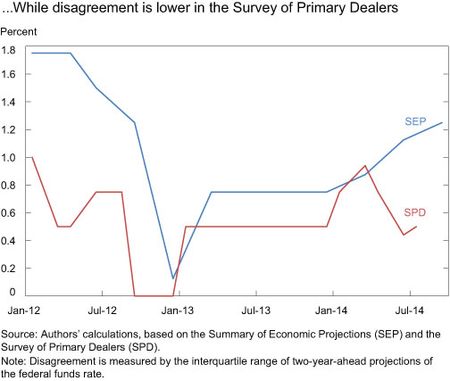
The chart below shows the disagreement, as measured by the interquartile range, among participants in the SPD and the SEP for two-year-ahead projections of the FFR. While there is some dispersion among primary dealers’ forecasts, FOMC members have disagreed considerably more over the past three years.
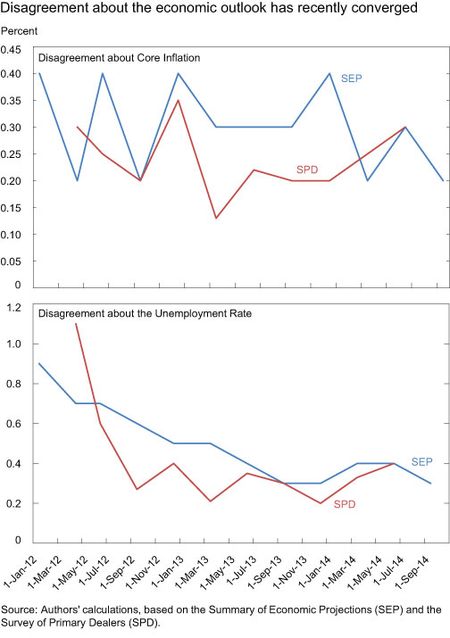
How do we explain these differences? As we mentioned above, disagreement about the policy rate can arise due to differences in the economic outlook. And indeed, less disagreement among private forecasts relative to the SEP is not unique to the FFR, but is also evident in forecasts for inflation and the unemployment rate. For example, the chart below compares disagreement across surveys for the two-year-ahead forecasts of core inflation. The measures of disagreement differ slightly across the two surveys because of data availability. For the SPD, the measure is the interquartile range, whereas for the SEP it is the difference between the fourth highest and fourth lowest forecasts. However, for the typical number of respondents to the SEP, these two measures should be approximately the same.
Similar to the FFR, disagreement about inflation and the unemployment rate over a two-year horizon in the SPD has been below the SEP most of the time, although they have recently converged. Note also that disagreement about the outlook for the unemployment rate has declined markedly in both the SEP and SPD. Several factors could explain declining disagreement about the unemployment rate since early 2012. By most estimates, the economy will be at or close to full employment in a two-year horizon; as the economy approaches full employment, forecasters anticipate adjustments in monetary policy to keep the unemployment rate near its longer-run level, and are thus less likely to disagree. That is, the forecasts today cluster around estimates of the long-run estimate for the unemployment rate.
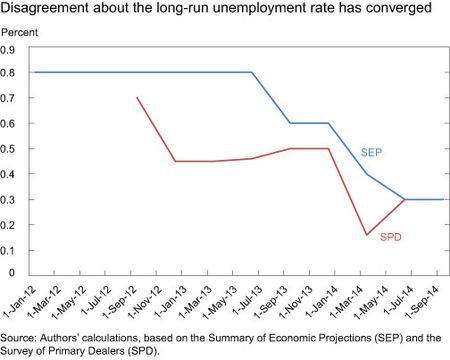
In addition, we see in the chart below how disagreement about the unemployment rate in the longer-run has evolved across the two surveys. Disagreement about this measure of the unemployment rate has recently converged. This narrowing likely also contributes to the corresponding alignment in disagreement in the two-year unemployment rate forecasts shown above.
Overall, the FOMC has tended to disagree more about the path of the FFR than market participants. One potential explanation for the difference is that FOMC members have disagreed more about the outlook for unemployment and inflation. However, we can’t rule out that private-sector participants disagree less about the outlook because they disagree less about the future path of the policy rate. That said, disagreement about unemployment in the longer-run should not be driven by policy expectations, and disagreement about this variable, at least until very recently, has been lower in the SPD than in the SEP. In addition, even if disagreement about the outlook in both surveys is the same, we should expect the FOMC to disagree more because private forecasters attempt to predict the most likely policy outcomes, whereas FOMC members report their views on the appropriate path for the FFR. That is, the dots represent policy prescriptions of each FOMC participant, rather than forecasts.
Disclaimer
The views expressed in this post are those of the authors and do not necessarily reflect the position of the Federal Reserve Bank of New York or the Federal Reserve System. Any errors or omissions are the responsibility of the authors.

Richard K. Crump is an officer in the Federal Reserve Bank of New York’s Research and Statistics Group.

Troy A. Davig is a senior vice president and the director of research of the Federal Reserve Bank of Kansas City.

Stefano Eusepi is an officer in the Federal Reserve Bank of New York’s Research and Statistics Group.

Emanuel Moench is an officer in the Federal Reserve Bank of New York’s Research and Statistics Group.


 RSS Feed
 Follow Liberty Street Economics
This analysis highlights the shortfall of the SEP in its current form. In an ideal world, we should want to measure the variation in policy forecasts from a standard Taylor rule to judge the variation in policymaker’s estimates for NAIRU, the Phillips curve, and the level of r-star. By providing individual estimates for the policy rule but not associating those estimates with specific forecasts for inflation and unemployment, the information falls well short of useful, failing to convey the evolution of the policy reaction function. Even here, we’re not certain if disagreement on the unemployment rate is indicative of anything as it may overstate disagreement on the output gap if participant’s estimates of NAIRU vary similarly, and the link to disagreement on the policy setting may be much more a function of differing estimates of the Phillips curve or the equilibrium rate.