In June of this year—as we noted in the preceding post—settlement fails in U.S. Treasury securities spiked to their highest level since the implementation of the fails charge in May 2009. Our first post reviewed what fails are, why they arise, and how they can be measured. In this post, we dig into the fails data to identify possible explanations for the high level of fails in June. We observe that sequential fails of several benchmark securities accounted for the lion’s share of fails in June, but that fails in seasoned securities—which have been trending upward for some time—were also elevated.
The June Spike in Treasury Settlement Fails
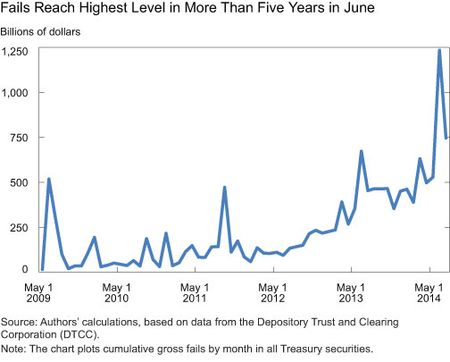
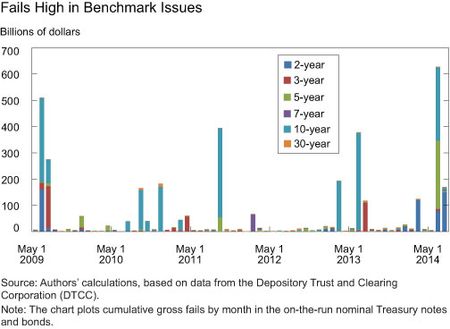
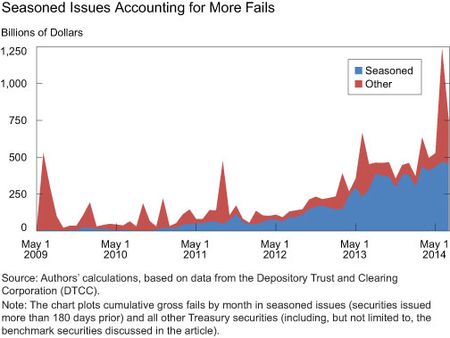
Settlement fails in U.S. Treasury securities rose to their highest level in more than five years in June (but remained well below fails levels seen in past episodes, as noted in our earlier post). Among the netting membership of the Depository Trust and Clearing Corporation (DTCC), gross fails reached more than $1.2 trillion for the month, as shown in the chart below. So what explains the June spike? It can be broken out into two main components. First, a series of fails in several benchmark (that is, “on-the-run”) securities accounted for the majority ($627 billion) of fails. But a continued trend of elevated fails in seasoned securities, or securities issued more than 180 days prior, accounted for an additional $470 billion of fails. We discuss each in turn.
Serial Benchmark Fails
In explaining the high level of fails in June, market observers focused on a sequence of fail episodes in the ten-, two-, and five-year benchmark notes. In each case, a sizable “short position,” or position designed to profit from higher future interest rates, was reported as an important factor driving higher demand to borrow the note. Market participants establish short positions by selling securities they do not own, and then need to borrow the securities to make delivery on such positions. A large number of short positions are typical for benchmark securities, which are preferred instruments for establishing such positions in Treasuries because of their superior liquidity properties and the ease with which they can usually be borrowed. In some instances, limitations in the available supply of these individual securities may have contributed to the level of fails. Nonetheless, the three episodes of fails proved short-lived, suggesting that occasional supply constraints in the benchmark issues were quickly resolved if and when they did occur.
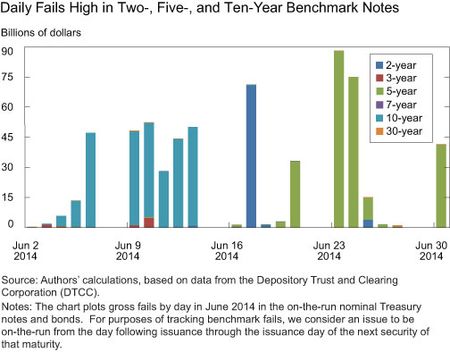
The benchmark ten-year note has experienced fails with some regularity since the crisis, particularly following the issuance date of a new ten-year note, as was the case in early June. In its current auction structure, the Treasury issues a new ten-year note once every quarter, and has scheduled “reopenings” in the two subsequent months whereby additional issuance increases the outstanding amount of the note. As a result, the outstanding quantity of the benchmark ten-year note is smallest following the first auction, and grows with each reopening. Indeed, the ten-year note has experienced eleven episodes in which gross settlement fails cumulated over the month have exceeded $10 billion since May 2009, as seen in the chart above, and most of these episodes have coincided with the weeks ahead of the first scheduled reopening when the issue size is smallest. In the most recent episode, after the scheduled ten-year reopening on June 15, the issue quickly lost its scarcity value and fails plunged, as shown in the following chart, suggesting that the new supply from the reopening alleviated the market imbalance in the issue.
In the case of the two-year note, fails were concentrated on a single day—June 17, when they totaled $71 billion gross—before reverting to a de minimis level, as seen in the chart above. This one-day pattern is consistent with a temporary reduction in the amount of the issue that was available for borrowing. Why might a security be withdrawn from the market for a single day? One possible explanation is that a large block of the security changed hands from one investor to another. Some buyers of a security wait until they actually receive delivery of the security before entering into contracts to lend them out. Because some securities are delivered late in the day, well after the securities lending markets are active, a significant change in the ownership of a specific security can result in a one-day discontinuity in the borrowable supply of that security, increasing fails. While we have no proof of this for the benchmark two-year note, the one-day spike in fails that we observe is consistent with such a story.
Fails in the five-year benchmark note garnered particular attention because fails occur less frequently in that benchmark than in the ten-year benchmark. The fails in the five-year benchmark in June clustered in two distinct episodes. The first episode took place from June 20 to June 26, with gross fails peaking at $88 billion on June 23. After transactions in the security cleared normally for two days, gross fails rose to $41 billion for a single day on June 30, which marked the settlement of the newly issued five-year note maturing in June 2019 as well as the end of the second quarter. In addition to citing a sizable number of short positions in this issue, some market participants noted some volatility in the borrowable supply of the security coincident with the first fails spike. Some participants also cited balance sheet pressures associated with the quarter-end financial reporting date as a potential factor contributing to the second fails spike on June 30.
Evidence suggests that the Federal Reserve’s sizable holdings of Treasury securities were not a direct contributing factor to the recent increase in settlement fails. The fails in benchmark securities, in particular, occurred in securities not owned by the Fed or owned in de minimis amounts. In fact, market participants suggested that it would likely have been helpful if the Fed’s securities portfolio had held more of these benchmark securities in June as securities held by the Fed are available to be lent every da
y, and such continuous supply tends to alleviate funding market stress.
Outright Market Impact Limited
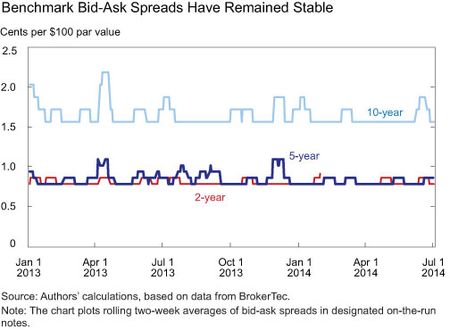
As noted in our preceding post, one reason fails can be a concern is that they could negatively impact the liquidity of the market for Treasury securities. This did not happen in June, despite the high levels of fails seen in benchmark securities. In particular, bid-ask spreads, which serve as one way of measuring the cost of transacting in the market, remained within recent ranges, as shown in the chart below. This was a welcome outcome because persistently higher levels of fails could lead to higher expectations of future fails, which in turn could create an adverse feedback loop that makes expectations of future fails self-fulfilling. For example, if a market participant perceived a greater probability that it would fail to receive back a security it had lent, it might be more reticent to initiate a lending transaction, thereby reducing supply and increasing the likelihood of a market imbalance. The fact that the June fails did not spill over into cash market liquidity measures suggests that market participants expected the fails to prove temporary.
Off-The-Run Fails Elevated
Fails in well off-the-run securities were also elevated in June. In fact, there has been a steady rise in fails of well off-the-run securities in recent years, as shown in the next chart. These fails have tended to be small in size, frequent in occurrence, and widespread across numerous aged Treasury securities. Such fails were modest throughout much of June, but spiked higher on the June 30 quarter-end date. These fails then declined to more normal levels the next day and remained in recent ranges subsequently.
The causes of these fails are hard to identify. As noted above, some observers have suggested that recent regulatory initiatives have resulted in more active management of balance sheet size around financial reporting dates, implying that some institutions may be more reluctant to intermediate securities loans or repurchase agreements on month- and quarter-ends than in the past. Increased management of balance sheet size would be consistent with a gradual rise in fails over the last couple of years and an acute quarter-end spike. At the same time, the trend in fails in seasoned issues seems to have started before recent regulatory initiatives were binding. Thus, it is not easy to validate or refute the “cost of balance sheet” argument with currently available data.
Closing Remarks
While settlement fail spikes in three different benchmark issues in June were unwelcome disruptions to Treasury market functioning, all were resolved in one to several days, ending before there were any notable knock-on effects to overall Treasury market liquidity or prices. There was no evidence of a negative feedback loop leading to reduced lending market participation that might be associated with persistently elevated fails. Perhaps more puzzling is the longer-running rise in fails of well off-the-run or “seasoned” issues—a trend we plan to follow and explore further in coming months.
The views expressed in this post are those of the authors and do not necessarily reflect the position of the Federal Reserve Bank of New York or the Federal Reserve System. Any errors or omissions are the responsibility of the authors.

Michael J. Fleming is a vice president in the Federal Reserve Bank of New York’s Research and Statistics Group.

Frank M. Keane is an assistant vice president in the Bank’s Markets Group.

Antoine Martin is a vice president in the Bank’s Research and Statistics Group.



 RSS Feed
 Follow Liberty Street Economics
Thank you for your comment. The Fed currently owns $2.4 trillion in Treasury securities (see http://www.federalreserve.gov/releases/h41/Current/) and holdings have increased substantially in recent years (see, for example, http://libertystreeteconomics.newyorkfed.org/2013/08/the-soma-portfolio-through-time.html), but in June 2014 the Fed did not own the failing benchmark securities in meaningful amounts. The Fed’s holdings of individual securities can be queried here: http://www.newyorkfed.org/markets/soma/sysopen_accholdings.html#.
You state the following: “The fails in benchmark securities, in particular, occurred in securities not owned by the Fed or owned in de minimis amounts.” However a quick break down of the Fed holdings result in this: http://research.stlouisfed.org/fred2/graph/?g=L33 The holdings of papers maturing in 1-10 years don’t look very “de minimis” to me. At least not on a nominal basis.
This is a useful and interesting post. As the authors say, there is not yet a clear story for the cause of the growth in fails. That’s the most interesting question here. We do know some relevant factors. Dealer inventories of treasuries are much lower than pre-crisis, but they have been somewhat stable for a few years, so that on its own doesn’t do it. The end-of-quarter stinginess of dealers with balance sheets is a factor mentioned by the authors. Dealers are placing more and more emphasis on reducing balance sheets in the face of pending leverage requirements, LCR, and NSFR, and they are not waiting until all regulations are in place. Volatility is low, which reduces inventory needs, but when vol is low, anyone shorting for a given risk exposure wants to take a bigger short position, stressing deliveries. The 3% fail penalty is not high enough, but that hasn’t changed recently. We don’t know much about which owners are keeping their treasuries away from the repo market, but that could be relevant. Foreign central banks own a lot of UST. There are a lot more direct bidders now in the auctions; perhaps the fact that treasuries are flowing directly to ultimate investors, and not hanging around on the street for a while, is important. The authors point out the interesting effect that predictions of high fail rates could be self-fulfilling. I would be interested to know if anyone can construct an important counterparty credit risk scenario that is related to delivery fails.