Global asset market developments during the summer of 2013 have been attributed to changes in the outlook for U.S. monetary policy, starting with former Chairman Bernanke’s May 22 comments concerning future curtailing of the Federal Reserve’s asset purchase programs. A previous post found that the signal of a possible change in U.S. monetary policy coincided with an increase in global risk aversion which put downward pressure on global asset prices. This post revisits this episode by measuring the impact of changes in Fed’s expected policy rate path and in the economic outlook on the U.S. dollar and emerging market equity prices. The analysis suggests that changes in the U.S. and foreign outlooks had a meaningful role in explaining global asset price movements during the so-called taper tantrum.
The earlier post Risk Aversion, Global Asset Prices, and Fed Tightening Signals used a statistical model estimated with data for U.S., euro area, Japanese and emerging market equity markets, the U.S. and euro area bond markets, commodities, and the dollar, where the current changes in the values of these assets are regressed on past changes in the values of all the assets, with the changes not explained being “residuals.” Then, shocks to risk aversion were estimated by looking at shifts in the correlations across the model’s residuals when there are large changes in overall implied volatility. That analysis suggested that substantial increases in risk aversion coincided with Bernanke’s testimony, resulting in a significant downward pressure on global asset prices in the two months after it.
However, measuring changes to global risk aversion is a difficult exercise and the previous effort did not link it explicitly to either changes in policy expectations or to changes in the economic outlook. Here, the same statistical model and methodology are used to look at shifts in the corresponding residuals’ correlations on three sets of days:
- Days when there are major U.S. data releases, where the news is measured by comparing for each release the Bloomberg consensus expectation with the realization. A weighted average is constructed, using the covariance with the average model residual on a day as weights, of these data-release surprises across nineteen U.S. releases, ranging from GDP to price, labor market, and housing indicators.
- Days when there are major foreign data releases with a similar weighted average constructed for the advanced foreign economies as well as some emerging market economies.
- Finally, for days when there are Federal Open Market Committee (FOMC) statements, the changes in Fed funds futures and Eurodollar futures (up to a maturity of three years), adjusted for credit risk and data release surprises on these days, are used to measure changes in the expected future path of the Fed’s policy taking the approach of Gürkaynak, Swanson, and Sack (2005).
Using an approach similar to that used in Mertens and Ravn (2013), it is possible to quantify the shocks due to revisions in market participants’ U.S. and foreign economic outlooks as well as due to revisions in expected future Fed policy and use the model to estimate the impact of these shocks on asset prices.
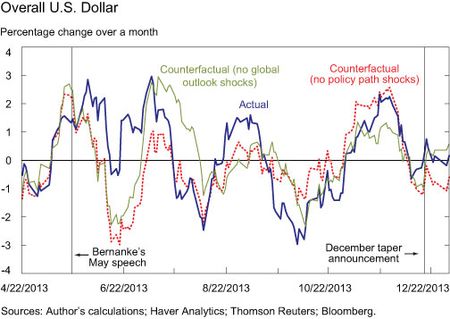
The chart below plots the percentage change over the previous month on a given day of an index of forty-five dollar exchange rates. The blue line is actual data, the red line is the counterfactual version where the model strips out shocks to the expected Fed policy, and the green line strips out shocks to both the U.S. and foreign economic outlook. The gaps with the actual swings indicate the degree to which the two types of shocks affected the dollar.
The chart above marks Bernanke’s testimony to Congress and the December 18, 2013, FOMC statement as key events, with Bernanke’s discussion of tapering leading to heightened uncertainty about the Fed’s monetary policy path and the December FOMC statement announcing the actual tapering of large-scale asset purchases starting in January 2014. The model suggests that the dollar appreciation from May through June 2013 can be explained as a result of a change in market reassessments of the Fed’s policy path going forward, but can also be explained by changing U.S. and foreign growth expectations.
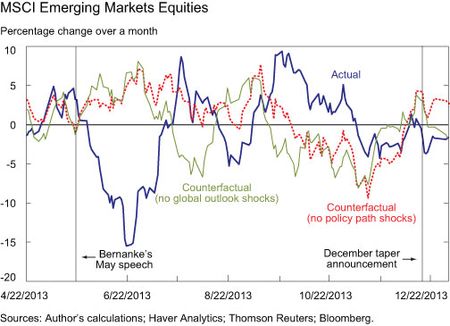
A similar pattern is evident in the chart below for emerging market equity prices. We see the model has Fed policy path expectations or U.S. and foreign growth expectations as being able to explain the fall in emerging market equities in June and July.
Note that in both charts the story is different around the time of the December taper announcement. It was a reassessment of future Fed policy and not revisions of growth expectations that was pushing the dollar higher and emerging market equity prices lower during this period.
Disclaimer
The views expressed in this post are those of the authors and do not necessarily reflect the position of the Federal Reserve Bank of New York or the Federal Reserve System. Any errors or omissions are the responsibility of the authors.

Jan J.J. Groen is an officer in the Federal Reserve Bank of New York’s Research and Statistics Group.


 RSS Feed
 Follow Liberty Street Economics