In March, the Federal Reserve and thirty-one large U.S. bank holding companies (BHCs) announced results of the latest Dodd-Frank Act-mandated stress tests. Some commentators have argued that BHCs, in designing their stress test models, have strong incentives to mimic the Fed’s stress test results, since the Fed’s results are an integral part of the Federal Reserve’s supervisory assessment of capital adequacy for these firms. In this post, we look at the 2015 stress test projections by the eighteen largest U.S. BHCs and by the Fed and compare them to similar numbers from 2013 and 2014. As stress testing becomes more established, do we see evidence that the BHCs are mimicking the Fed?
DFAST Stress Testing
The Dodd-Frank Act requires both large BHCs and the Fed to conduct annual stress tests under macroeconomic scenarios provided by the Fed. These stress tests are designed to measure the impact of adverse economic and financial market conditions on each BHC’s income and regulatory capital ratios. The Dodd-Frank Act stress test (DFAST) results are publicly disclosed each year by the BHCs and the Fed.
As we explained in a previous post, the projections by the BHCs and the Fed are made under the same macroeconomic scenarios, but the results differ, primarily because of differences in the models used. Schuermann has pointed out that BHCs have incentives to imitate the Fed’s stress test models. These incentives pose a potential risk to the financial system, since, in trying to replicate the Fed’s results, BHCs might divert resources from the development of innovative models more tailored to their own risks and business strategies. A financial system in which BHCs have similar risk measurement models could be less stable than a system in which firms use diverse models that, collectively, might be more likely to identify emerging risks. Glasserman and Tangirala contend that the Fed’s projections of loan losses—a key element of the stress test projections, though not the only important component—are predictable for individual BHCs from one year to the next. Such predictability might make it easier for the BHCs to mirror the Fed’s results, enhancing concerns about “model monoculture.” Each year’s release of stress test results offers a new opportunity to test these concerns in the data.
Convergence of Fed and BHC Results?
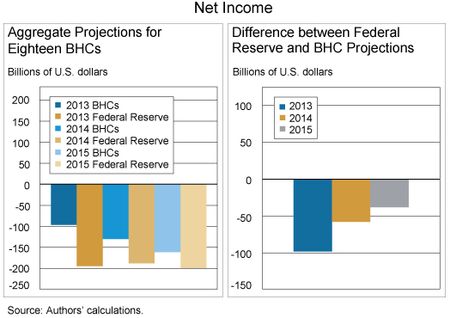
The chart on the left below shows aggregate projections of net income by BHCs and the Fed in 2013, 2014, and 2015 under the Fed’s severely adverse scenario. In the DFAST calculations, net income is calculated as pre-provision net revenue (PPNR)—equal to net interest income plus non-interest income minus non-interest expense—minus losses on loans, securities, trading, and derivatives positions. The chart shows cumulative net income over the nine quarters of the stress test horizon in the aggregate for the eighteen BHCs that participated in the 2013, 2014, and 2015 DFAST programs.
In all three years, aggregate net income for the eighteen BHCs as projected by the Fed is lower than the aggregate of the eighteen individual BHC projections; in 2015, a loss of about $200 billion is projected by the Fed, compared with a loss of about $160 billion projected by the BHCs. Notably, the difference between Fed and BHC net income projections has declined over time. This convergence is clear in the chart on the right, above.
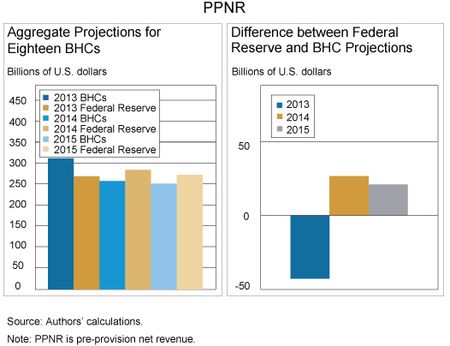
While the aggregate net income projections appear to be converging, examining the underlying components of these projections presents a more nuanced picture. The four charts below present aggregate projections for DFAST 2013, 2014, and 2015 for two of the most important components of net income: PPNR and loan losses. As shown in the first two charts, Federal Reserve projections of PPNR were lower than the BHC projections in 2013 and higher in 2014 and 2015, but the gap between them has closed in absolute terms. Most of the convergence in PPNR occurred before 2015.
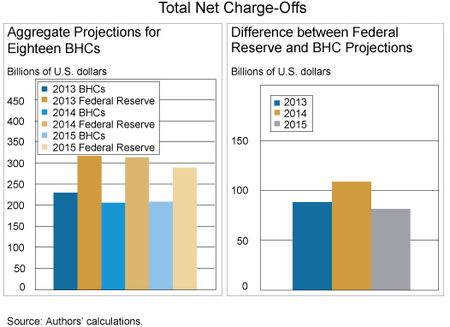
The two charts below show BHC and Federal Reserve projections of loan losses (net charge-offs). While the difference between the BHC and Fed loan loss projections declined from 2014 to 2015, it is roughly comparable to the gap in 2013, and fairly large in absolute terms, so the longer-term convergence of the loan loss projections has been limited. The convergence in 2015 primarily reflects a decrease in projected loan losses by the Fed as compared to relatively stable aggregate loan loss projections by the BHCs (see the chart on the left).
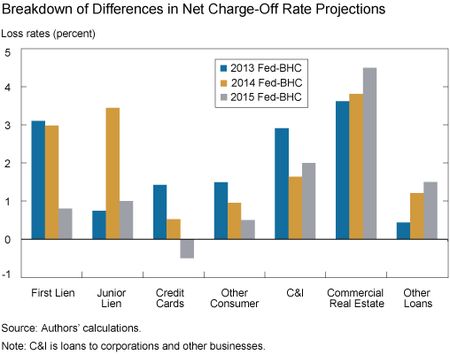
The results for total loan losses mask differences across types of loans. The chart below compares loss rates on different categories of loans, as projected by the BHCs and the Fed. As shown on the left, relative to 2014, the BHC and Federal Reserve loan loss projections are converging for most categories of retail loans, but the gap between the BHC and Fed loss projections for wholesale loan categories, shown on the right, increased from 2014 to 2015.
Persistent Differences between Projections of Loan Loss Rates
The gap between the Fed and BHC projections of loan loss rates could be persistent because of differences in the timing of recognition of loan losses over the stress test horizon. Most of the Fed loan loss projections are based on expected losses, an economic loss concept that tends to accelerate loss recognition as compared to accounting-based net loan charge-offs that may be the basis of some of the BHC models. However, since these numbers are aggregated over the nine quarters of the severely adverse scenario, and some part of the acceleration takes places within the scenario horizon, the net impact on the reported figures will be reduced. Without additional details, it is difficult to calculate how much of this gap stems from the timing of loss recognition. (This difference primarily affects the comparison of loan losses and loan loss rates across models; the impact on nine-quarter aggregate net income is likely small because it is loan loss provisions—which incorporate expected future losses—that determine net income, not loan losses. Accelerated loan loss recognition lowers the allowance for loan and lease losses (ALLL) needed at the end of the scenario horizon to cover future loan losses, so that provisions into the ALLL are comparable across loan loss definitions.)
What Might Drive Convergence?
Each year’s results are based on new initial conditions for individual BHCs, for the banking industry, and for the economy. Loan portfolios, balance sheets, and business mix can change from year to year, though in most cases such changes are incremental rather than abrupt. While these factors can create differences in projections over time, they are common to the BHCs and to the Fed, so it is not clear that they would change the relationship between the BHC and Federal Reserve results.
Changes in modeling approaches are natural candidates to consider as drivers of convergence or divergence of the BHC and Fed forecasts. If the BHCs or the Fed significantly changed their models, this could change the relationship between their projections. The Fed describes, in qualitative terms, modeling changes that affect its projections. For example, in the paper reporting the 2015 results, the Fed indicated that “changes to accrual loan loss models were generally modest and did not have a large net effect on aggregate estimates of total loan losses,” suggesting that factors other than model changes accounted for the decrease in the Fed’s projected loan losses in 2015. There is less systematic public information about changes to the BHCs’ models, making it difficult to quantify the overall impact of modeling changes on the difference between the Fed and BHC results.
Even if the models have not changed significantly over time, differences between the models can drive changes in the relationship between the BHC and Fed projections over time. For example, the models might incorporate different sensitivities to the macroeconomic variables in the scenarios; one model might forecast that retail loan losses would increase by 10 basis points for each 10-basis-point increase in the unemployment rate, while another model projects that retail loan losses would increase by 20 basis points. Given that difference, if the macroeconomic scenario in one year involves a bigger increase in the unemployment rate than in the previous year, then the models’ projections will be further apart than in the previous year, even if the models have not changed.
Convergence is Complex to Interpret
Overall, our comparison of DFAST stress test results from 2013, 2014, and 2015 presents mixed evidence that the BHC and Fed projections are converging. While the aggregate net income and PPNR projections have gotten closer, projected loan losses have not. Overall, the gap between the Fed and the BHC loan loss projections in 2015 is roughly the same as in 2013, and the difference is sizeable. Some part of this gap might reflect differences in the definition of losses being modeled, and thus could be persistent. Even so, the relationship between the Fed’s and the BHCs’ loan loss projections varies for different types of loans, with aggregate BHC and Fed projections of losses on retail loans converging over time, and projections of losses on wholesale loans diverging.
That the gap is trending in different directions for different types of loans suggests that multiple factors determine the closeness of the Fed’s and the BHCs’ projections, including changes in initial conditions, changes in scenarios, and differing sensitivities of models to key variables in the scenarios, as well as changes in the BHCs’ or Fed’s models. Determining the implications of convergence to concerns about model monoculture is thus complex, especially given the relatively short history of results (three years) for a limited number of firms.
The findings in this post are aggregated results for the eighteen large BHCs that participated in each of the 2013, 2014, and 2015 DFAST stress tests and thus show how the Fed and BHC projections compare on average. In future posts, we will compare the projections of individual BHCs and the Fed to develop more insight into concerns about convergence and how the relationships among these projections have evolved.
Background: Links to the Fed and BHC DFAST Results
2015 Fed DFAST Results
2015 BHC DFAST Results
Disclaimer
The views expressed in this post are those of the authors and do not necessarily reflect the position of the Federal Reserve Bank of New York or the Federal Reserve System. Any errors or omissions are the responsibility of the authors.

Beverly Hirtle is a senior vice president in the Federal Reserve Bank of New York’s Research and Statistics Group.

Anna Kovner is an assistant vice president in the Bank’s Research and Statistics Group.
 Eric McKay is a senior research analyst in the Bank’s Research and Statistics Group.


 RSS Feed
 Follow Liberty Street Economics