There is no consensus among economists as to what drove the rise of U.S. house prices and household debt in the period leading up to the recent financial crisis. In this post, we argue that the fundamental factor behind that boom was an increase in the supply of mortgage credit, which was brought about by securitization and shadow banking, along with a surge in capital inflows from abroad. This argument is based on the interpretation of four macroeconomic developments between 2000 and 2006 provided by a general equilibrium model of housing and credit.
The financial crisis precipitated the worst recession since the Great Depression. The spectacular rise in house prices and household debt during the first half of the 2000s, which is illustrated in the first two charts, was a crucial factor behind these events. Yet, economists disagree on the fundamental causes of this credit and housing boom.
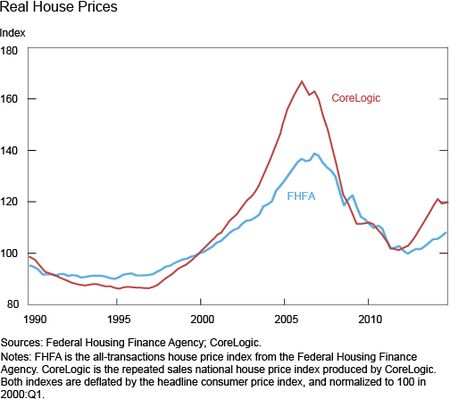
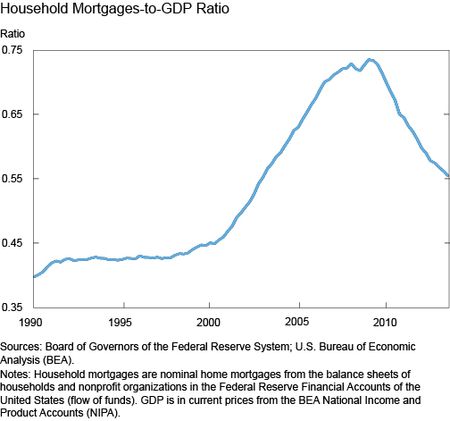
A common narrative attributes the surge in debt and house prices to a loosening of collateral requirements for mortgages, associated with higher initial loan-to-value (LTV) ratios, multiple mortgages on the same property, and expansive home equity lines of credit.
The fact that collateral requirements became looser, at least for certain borrowers, is fairly uncontroversial. But can higher LTVs account for the unprecedented increase in house prices and debt, while remaining consistent with other macroeconomic developments during the same period?
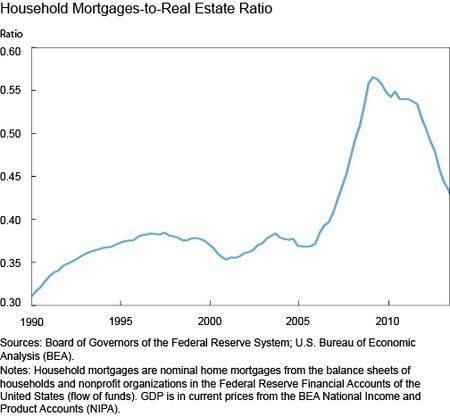
Two facts suggest that the answer to this question is no. First, if the relaxation of collateral constraints had been widespread, it should have resulted in a surge of mortgage debt relative to the value of real estate. In the data, however, household debt and real estate values rose in tandem, leaving their ratio roughly unchanged over the first half of the 2000s, as shown in the chart below. In fact, this ratio only spiked when home prices tumbled, starting in 2006.
Second, more relaxed collateral requirements make it possible for the borrowers to demand more credit. Therefore, interest rates should rise to convince the lenders to satisfy this additional demand. In the data, however, real mortgage interest rates fell during the 2000s, as shown below in the fourth chart.
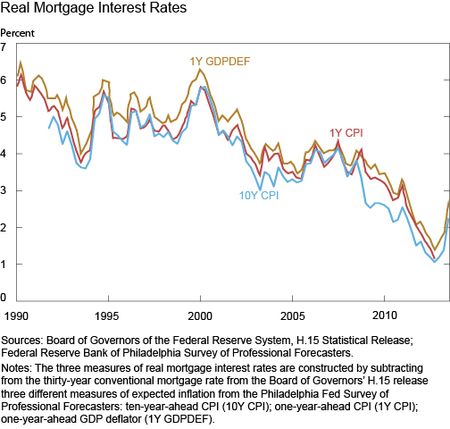
The fall in mortgage interest rates depicted in the fourth chart points to a shift in credit supply as an alternative explanation of the credit and housing boom of the early 2000s. We develop this hypothesis within a simple general equilibrium model in Justiniano, Primiceri, and Tambalotti (2015).
In the model, borrowing is limited by a collateral constraint linked to real estate values. Changes to this constraint, such as when the maximum LTV increases, shift the demand for credit. On the lending side, there is a limit to the amount of funds that savers can direct toward mortgage finance, which is equivalent to a leverage restriction on financial intermediaries. Changes to this constraint shift the supply of credit.
Lending constraints capture a host of technological and institutional factors that restrain the flow of savings into the mortgage market. Starting in the late 1990s, the explosion of securitization together with changes in the regulatory environment lowered many of these barriers, increasing the supply of mortgage credit.
The pooling and tranching of mortgages into mortgage-backed securities (MBS) played a central role in loosening lending constraints through several channels. First, tranching creates highly rated assets out of pools of risky mortgages. These assets can then be purchased by those institutional investors that are restricted by regulation to hold only fixed-income securities with high ratings. As a result, the boom in securitization channeled into mortgages a large pool of savings that had previously been directed toward other safe assets, such as government bonds. Second, investing in these senior MBS tranches freed up intermediary capital, owing to their lower regulatory charges. This form of “regulatory arbitrage” allowed banks to increase leverage without raising new capital, expanding their ability to supply credit to mortgage markets. Third, securitization allowed banks to convert illiquid loans into liquid funds, reducing their funding costs and hence increasing their capacity to lend.
International factors also played an important role in increasing the supply of funds available to American home buyers, as global saving flowed into U.S. safe assets, including agency MBS, before the financial crisis (Bernanke, Bertaut, Pounder, DeMarco, and Kamin 2011).
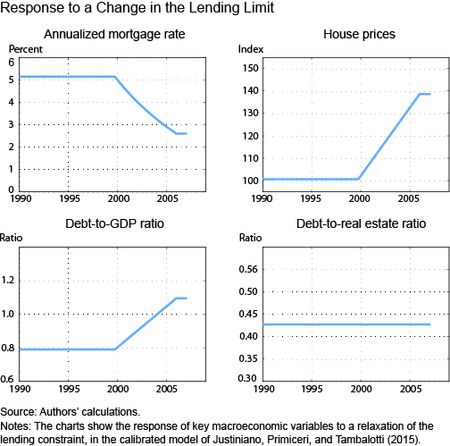
The fifth chart plots the effects of a relaxation of lending constraints in our model. When savers and financial institutions are less restricted in their lending, the supply of credit increases and interest rates fall. Since access to credit requires collateral, the increased availability of funds at lower interest rates makes the existing collateral—houses—scarcer and hence more valuable. As a result of higher real estate values, borrowers can increase their debt, even though their debt-to-collateral ratio remains unchanged. These responses of debt, house prices, aggregate leverage, and mortgage rates match well the empirical facts illustrated in the previous four charts. We conclude from this experiment that a shift in credit supply, associated with looser lending constraints, was the fundamental driver of the credit and housing boom that preceded the Great Recession.
This interpretation of the sources of the credit and housing boom is consistent with the microeconometric evidence presented in the influential work of Mian and Sufi (2009, 2010). They show that an expansion in credit supply was the fundamental driver of the surge in household debt and that borrowing against the increased value of real estate accounts for a significant fraction of this build-up in debt.
Our model, by providing a theoretical perspective on the important factors behind the financial crisis, should prove useful as a framework to study policies that might prevent a repeat of this experience.
Disclaimer
The views expressed in this post are those of the authors and do not necessarily reflect the position of the Federal Reserve Bank of Chicago, the Federal Reserve Bank of New York, or the Federal Reserve System. Any errors or omissions are the responsibility of the author.
Alejandro Justiniano is a senior economist and research advisor in the Federal Reserve Bank of Chicago’s Economic Research Department.
Giorgio E. Primiceri is an associate professor at Northwestern University.

Andrea Tambalotti is an assistant vice president in the Federal Reserve Bank of New York’s Research and Statistics Group.


 RSS Feed
 Follow Liberty Street Economics
As you touched on in your introduction the availability of capital inflows from abroad was an enabler of the credit dynamic you describe in your model. The massive accumulation of reserves by emerging economies (China, Russia, etc) in effect allowed this process to proceed without the usual circuit breakers kicking in. The “S” in the I=S identity was effectively unlimited.
I haven’t seen much analysis of the impact of the Taxpayer Relief Act of 1997, which seems to be responsible for just as much of the increase in home prices as growth in the credit supply. For sales after May 6, 1997, the law allows you to exclude from income gain on the sale of your principal residence of up to $250,000 ($500,000 if you are married and file a joint return). (The old law taxed the gain, required detailed tracking of basis, and had special provisions regarding rollover of gain into a new residence and a one-time $125,000 exclusion of gain.) In order to qualify for the new exclusion, you must have used the home as your principal residence for at least 2 of the 5 years before the sale. You can use the exclusion once every 2 years. Some people in fact moved every two years during the bubble.
Timeline: 2000: Couple with $X income prequalifies for $100K mortgage (FRM or ARM). 2002: Couple with $X income prequalifies for $142K mortgage (ARM). 2000-2003: ARM market share increases and values are bid up by about 40%. 2000-2003: Refi boom ensues, with substantial cash-out, at new rates and values. 2001-5: homebuilders are financed at short, floating rates with carried interest. Their WACC is cut in half. More SFDH units are built than were built from 1987-2000. 1.5 million workers are directly, and 2.5 million indirectly, employed in resi construction, sales and mortgage fields. 2004-7: Fed hikes, but slowly. Credit is still growing. Index rises slowly; spread thins. Result is “teaser” rates. 2003-5: Default rates plummet, due to low rates, refi ability and cash-out refi proceeds available for debt service. Spending of proceeds is a 1-time boost to GDP. 2004-2006: banks and investors react to falling defaults, rising values and increased consumer spending and employment as if they were unrelated, standalone factors. Thresholds are loosened and credit flow into the US continues INDUCED by these stats. Low-FICO borrowers’ loans priced at 6% not 10% are more likely to cash flow. 2006-7: the Fed keeps hiking, ARMs re-set, values top rising, defaults suddenly spike, builders lay off, their former employees default, it all spirals. The increased risk is glossed over by CMO issuers. 2008: crash. = Post-9/11 cuts are the snowball. No snowball, no avalanche.
It’s a leveraged asset – of COURSE growth in the credit supply fueled the growth in the asset prices, just like the Silver Purchase Act fueled the bubble that led to the Panic of 1893. In this case that growth came from the post-9/11 rate cuts. A couple buying in 2003 with a median income could, by opting for an ARM structure, qualify for a mortage 45% higher than a couple buying in 2001 with a median income. Of that 45%, 42% was a function of the rates. Between 2001-2005, ARM share of all mortgages more than tripled. It’s simple – going short suddenly enabled you to buy 45% more house instead of 3%, and that’s what people did. At the same time, existing homeowners refinanced – half of them with cash out based on the new values – which were 45% higher. Builders – financed at short, floating rates with carried interest, were induced by the high prices, and enabled by their suddenly low cost of capital, to overbuild. One initial effect of the refis was a fall in default rates, via refis at lower rates or new amortization and/or cash-out proceeds initially available for payments. Lenders and investors failed to connect the historically low default rates and historically-rapid rise in collateral values to the low rates, and THEN adjusted LTV and FICO requirements. Also continued credit expansion allowed the weaker loans – which historically would have been made but at double digit rates – to cash flow thus to be made. The Fed is the root, and but-for, cause.
Re: “if the relaxation of collateral constraints had been widespread, it should have resulted in a surge of mortgage debt relative to the value of real estate” You assume that the overall demand flow (debt+equity) remains constant and hence the home price valuation, but I doubt it. Less debt = less demand flow=lower price rises…more debt=higher demand flow=higher price rises…. You confirm this here: “however, household debt and real estate values rose in tandem” Am I missing something here?