The Federal Reserve Bank of New York’s Survey of Consumer Expectations (SCE) turned two years old in June. In this post, we review some of the key findings from the first two years of the survey’s history, highlighting the most noteworthy trends revealed in the data.
The SCE is a nationally representative, Internet-based survey of a rotating panel of about 1,300 household heads in the United States. The survey contains a monthly core questionnaire that elicits consumers’ expectations on a broad variety of topics, covering both macroeconomic variables (such as inflation, home price changes, unemployment, and credit availability) and individual future outcomes (such as wage growth, the likelihood of losing or finding a job, household income, and spending growth). In addition to the monthly questionnaire, special survey modules are fielded at regular intervals on various topics, including credit access, labor market outcomes, and spending behavior, and annual surveys are fielded on housing, job search, and household consumption and saving.
Insights on Inflation Expectations
The SCE’s core module covers three main areas: inflation, the labor market, and household finance. Regarding inflation, respondents are asked about their expectations for the inflation rate as well as price changes for specific items including homes, education, medical care, food, and gasoline.
Median inflation expectations have been quite stable over the survey’s history, hovering at around 3 percent at both the short-term (one year ahead) and medium-term (three years ahead) horizon. Inflation expectations have tended to be lower for younger, more educated, and higher income respondents. One of the unique features of the SCE is that it contains a measure of forecast uncertainty for each individual that reflects the extent of his or her uncertainty over several possible future inflation outcomes. On average, inflation uncertainty has been mostly stable over the past two years, but it has recently declined for both the one-year-ahead and three-year-ahead horizons, suggesting that consumers have become relatively more confident about their outlook for inflation for both the short and medium term. In general, forecast uncertainty tends to be lower for more educated, higher income, and higher numeracy individuals. Finally, the probability that respondents assign to deflation outcomes has varied between 10 percent and 18 percent over the survey’s history (with a recent high in January 2015), and is now at 14.6 percent.
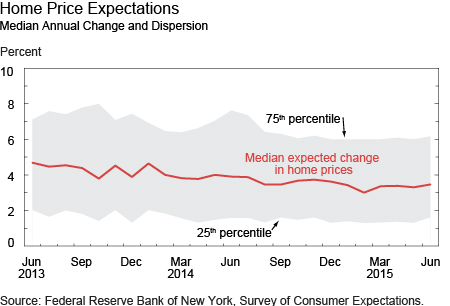
In contrast, expectations for home price changes have been gradually declining since the inception of the SCE (see chart below). The median expected one-year-ahead home price appreciation has fallen from 4.7 percent in June 2013 to 3.5 percent in June 2015. To put this in context, nationwide home prices increased by 11.4 percent in 2013 and by 4.8 percent in 2014—this would suggest, then, that home price expectations are possibly affected by consumers’ recent experienced home price changes. Expected home price appreciation tends to be higher for older respondents, and has been consistently higher for respondents in the western United States since early 2014.

The SCE also tracks price change expectations (one year ahead) for specific goods and services. Median expectations for changes in the cost of medical care and of college education have declined over the past two years, from about 10.1 percent and 9.5 percent, respectively, in June 2013 to 9 percent and 7.3 percent, respectively, in June 2015. Median expectations for changes in gas prices exhibit an interesting pattern: they were fairly stable until summer 2014, declined sharply in fall 2014—presumably reflecting the observed drop in oil and gasoline prices—but have since recovered and are now higher than those observed before 2015. This pattern suggests that consumers expect the recent rebound in gas prices to continue in the near term. Finally, food and rent inflation expectations have remained stable over the life of the survey.
Labor Market Expectations
The core monthly survey also queries households about various labor market expectations. Respondents are asked about their expected wage growth over the next twelve months, conditional on staying in the same job and working the same number of hours. Median wage growth expectations for all respondents were stable at around 2 percent in the second half of 2013 and rose gradually to a peak of 2.7 percent in November 2014, but have since stalled, with the latest reading at 2.5 percent in June 2015. Wage growth expectations have been gradually rising since the start of the SCE for workers over forty, workers with college educations, and those with household incomes below $50,000 or above $100,000. Overall, households’ short-term outlook for wage growth remains subdued relative to pre-recession levels.
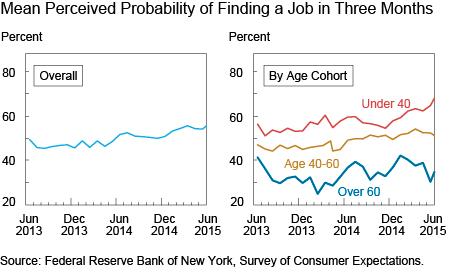
Expectations regarding the odds of finding a job paint a more positive picture of the labor market. For employed respondents, the mean perceived job-finding probability (in the next three months, conditional on losing one’s job today) has risen gradually from about 46 percent in summer 2013 to about 56 percent in more recent months (left panel below). This increase is broad-based across most education and income categories, but a notable gap has opened recently among younger and older workers: the mean perceived job-finding probability has improved to 68 percent for workers under forty, but has declined to 35.2 percent for workers sixty years of age and older (right panel below).

Workers are also less worried about becoming unemployed. The mean perceived probability of losing one’s job over the next twelve months has steadily declined since November 2013 and reached a new low in May 2015, at 13.8 percent. However, the mean perceived probability of leaving one’s job voluntarily has also declined slightly over roughly the same period, from 22.8 percent in October 2013 to 21 percent in June 2015. Voluntary quits typically rise during expansions as jobs become more readily available, and they are typically considered an indicator of prospective wage growth (as shown, for instance, here and here).
Expectations for Household Finance
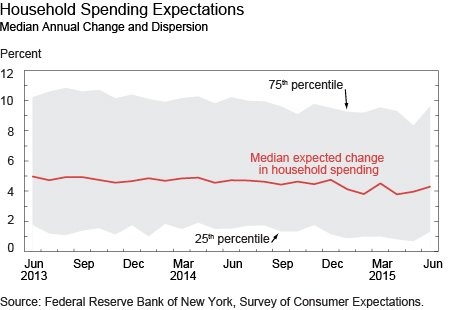
The third key area of interest in the SCE core monthly survey covers household finance expectations. Median expectations for annual income growth have been gradually rising, from a low of 2 percent in December 2013 to a recent series high of 2.9 percent in May 2015. The increase has been driven by college-educated and higher-income respondents. By contrast, median expectations for spending growth—which were fairly constant between 4.5 percent and 5 percent from the start of the survey to December 2014—declined to around 4 percent in spring 2015. The 25th and 75th percentiles of the distribution of expected spending growth among respondents have also shifted down, indicating a downward movement of the entire distribution—although there has been a rebound this June.

Finally, our indicators suggest that perceived credit conditions—both availability and prospects for repayment—have steadily improved since the inception of the SCE. The fraction of respondents expecting it to be somewhat or much harder to obtain credit one year from now declined from about 47 percent in the fall of 2013 to about 28 percent in June 2015. Further, the average perceived probability of missing a minimum debt payment over the next three months fell from a high of 17.2 percent in September 2013 to a series low of 11.4 percent in May 2015. This decline has been especially notable for respondents with a high school degree or less.
Summary
Expectations are believed to drive behavior, and, hence, effective monetary policy requires that the Federal Reserve have a good handle on consumers’ expectations. To that end, the SCE provides us with a rich picture of what U.S. households expect regarding overall inflation and specific prices, labor market conditions, and household finance conditions. A review of the survey’s first two years reveals that inflation expectations have generally been stable, with labor market expectations becoming cautiously more optimistic and household finance expectations evolving positively—except for household spending.
As the survey’s time series grows longer, we expect to conduct a range of analyses. In particular, we will see how household expectations relate to actual outcomes, both for macroeconomic aggregates and household-level variables.
Disclaimer
The views expressed in this post are those of the authors and do not necessarily reflect the position of the Federal Reserve Bank of New York or the Federal Reserve System. Any errors or omissions are the responsibility of the authors.

Giorgio Topa is a vice president in the Federal Reserve Bank of New York’s Research and Statistics Group.

Olivier Armantier is an assistant vice president in the Group.

Wilbert van der Klaauw is a senior vice president in the Group.


 RSS Feed
 Follow Liberty Street Economics