Update: We broadened our definition of Silicon Valley and present more complete data on that region’s trends in the comments section of this post. In the body of the piece, we also corrected the NAICS code for Scientific R&D Services.
For at least the past few decades, New York City’s economy, both its booms and busts, have been driven primarily by the finance sector, or more specifically the securities industry (a.k.a. Wall Street). In contrast, the city’s current economic boom—one of the strongest on record—has seen virtually no job growth on Wall Street. Much of the job creation has been in lower-paying sectors like retail trade, restaurants and hotels, and health care and social assistance, with some of the fastest job growth going on in what would be considered “information technology” industries—jobs that pay quite well for the most part. But how big is the Big Apple’s “tech sector,” how fast has it been growing, and how does it stack up against other tech hubs across the United States? Before addressing these questions, we must first answer a more fundamental question: what exactly is the tech sector?
How We Define the Tech Sector
This question is actually trickier and more subjective than it may appear. Traditional industries are classified based on what they produce, be it a manufacture or a service. But what we often think of as tech companies are actually just firms that are good at exploiting current technology in more traditional industries: local firms like Etsy (retail marketplace), Spotify (music distribution), Refinery29 (fashion magazine), and Uber (transportation services). A recently published study on the city’s “tech ecosystem” defines tech industries as those that “enable or produce technology,” but also notes that there plenty of tech jobs (based on occupational classifications) in non-tech industries.
While we recognize the important role and sizable number of tech jobs in traditional industries—for example here at the New York Fed—we will focus on a handful of industries in which firms use technology as the core of their business strategy. These industries will serve as a rough proxy for the tech sector. We then use these specific industry codes, as defined by the North American Industrial Classification System (NAICS), to approximate the relative size of New York City’s tech sector, to gauge how fast it has grown, and to compare New York with other leading high-tech cities. For the analysis presented below, we specifically focus on the following industry codes:
• NAICS 334
Computer Manufacturing• NAICS 454111
Electronic Shopping• NAICS 5112
Software Publishing• NAICS 518
Data Processing, Hosting & Related Services• NAICS 51913
Internet Publishing & Broadcasting and Web Search Portals• NAICS 5415
Computer Systems Design & Related• NAICS 5417
Scientific R&D Services
There are other industries that we arguably could have included—most notably telecommunications. However, we opt to exclude this industry, because most of these jobs are not what are typically viewed as “techie.” In fact, the vast majority of employment is at firms that rely more on existing infrastructure (such as fiber optic networks) than the development and creative implementation of technology as their primary productive asset.
A Geographic Profile of New York City’s Tech Sector
When asked where tech firms in the city are located, many New Yorkers will mention Silicon Alley in Manhattan—roughly speaking, the area between the Lower and Midtown Manhattan skylines. But as shown in the map on page 13 of this study, there are also plenty of tech firms in both Lower and Midtown Manhattan, as well as some clustered in neighborhoods of Brooklyn and Queens near the East River, where distance to Manhattan is minimized. Similarly, this map of New York tech start-ups shows that they proliferate throughout the southern part of Manhattan, while there are a few such clusters in nearby parts of Brooklyn and Queens.
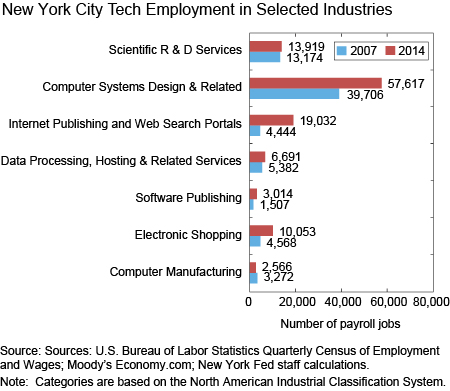
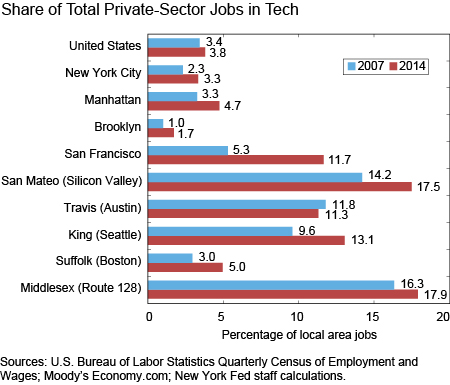
Using 2014 data from the Quarterly Census of Employment and Wages, we see that the vast majority of the city’s tech sector jobs (86 percent) are in Manhattan, while most of the rest are in Brooklyn and Queens. Overall, tech, as defined here, accounts for about 3½ percent of jobs citywide but almost 5 percent in Manhattan, which is about a percentage point above the nationwide share. Moreover, these industries, taken together, pay fairly well: an average of roughly $118,000 per year citywide as of 2013—not quite on par with the securities industry, but well above the citywide average for all jobs of $84,000. By far the largest of these industries is defined as Computer Systems Design & Related, which accounts for more than half of the city’s tech jobs (above the U.S. average of 40 percent). New York City also has a relatively high concentration of jobs in Electronic Shopping and Internet Publishing & Broadcasting and Web Search Portals. This makes sense when we consider that such firms as Spotify, Facebook, Etsy, BuzzFeed, and Seamless all have offices located in New York City. The numbers above illustrate the current tech landscape here, but how has this landscape changed over the past few years?
Recent Trends in the Tech Sector
Tallying up jobs or even income in just these industries will tend to understate the absolute size of New York City’s tech sector because it misses some businesses like online magazines, web-based advertising firms, and so forth. This count also does not include the self-employed—for instance, web designers, programmers, and other consultants who work on contract and are not on any firm’s payroll. Still, these job tallies can be useful for gauging trends and growth rates in the tech sector. The chart below shows how employment in New York City’s tech sector, as we define it, changed from 2007, before the Great Recession, to 2014, for which we have the latest available data.
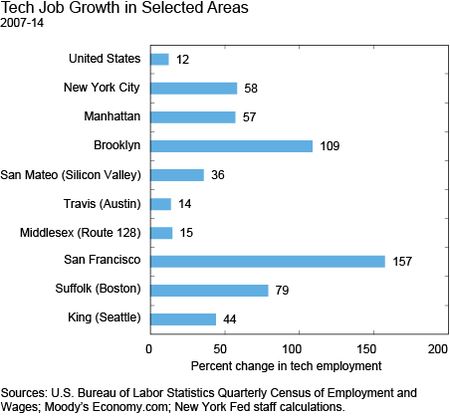
During this period, in which Wall Street employment fell by more than 25,000 (or roughly 11 percent), employment in these seven tech industries grew by 40,000 (57 percent)—nearly six times faster than citywide employment overall. But hasn’t the tech sector been growing like gangbusters throughout the nation? Apparently not so much: over the same seven-year period, nationwide employment in these industries has expanded by just 12 percent. This partly reflects the fact that computer manufacturing, which has been shedding jobs, represents a much larger share of this cluster nationally than locally. But even if we take manufacturing out of the mix, job growth in New York City’s tech sector still outpaces growth nationwide, 60 percent to 27 percent, or more than double.
How Does New York City Compare with Other Leading Tech Hubs?
Given that Manhattan does have an above-average share of tech jobs, how does it compare with other counties that are known as high-tech hubs, in terms of both level and trends? The chart below shows the comparative size and growth rate of the tech sectors in selected areas. While the sheer number of tech jobs in New York City (113,000), including Manhattan (84,000), is formidable, the share of local private-sector employment in technology is not even close to the proportion in the prime tech counties of Middlesex (Boston), King (Seattle), San Mateo (San Francisco), or Travis (Austin). Interestingly, only in the New York City and Seattle metro areas does the highest concentration of technology firms appear to be located in the central city. In the Boston, San Francisco, and Austin areas, tech firms tend to be concentrated in outlying areas—Route 128, Silicon Valley, and the Silicon Hills, respectively. San Francisco does have a relatively high concentration of tech jobs, but much less so than Silicon Valley (San Mateo County). Nonetheless, the fastest growth in tech employment seems to be in the central cities—a fairly recent trend discussed in this 2012 Wall Street Journal article.
One such central city, New York, has done comparatively well. As we see in the next chart, from 2007 to 2014, tech employment grew by 57 percent (40,000 net jobs)—considerably faster than in Silicon Valley (36 percent) or Route 128 near Boston (15 percent). As mentioned above, tech employment tended to grow rapidly not only in Manhattan and New York City as a whole but also in other counties that include primary central cities: by 79 percent in Suffolk County (Boston), and by a stunning 157 percent in San Francisco county. Meanwhile, tech employment grew 44 percent in King County (Seattle) but by a more modest 14 percent in Travis County (Austin). But it is difficult to gauge exactly what’s going on within these counties—more than just anecdotally—because they each comprise both the central city and the respective suburban tech hub (Redmond/Bellevue and Silicon Hills), and detailed jobs data are available only down to the county level.
New York City has a sizable tech sector in absolute terms. While its relative importance in the local economy pales in comparison with the other tech hubs, New York City has been creating tech jobs at a brisk pace and apparently benefitting from the broad trend toward urbanization, suggesting that it is quickly catching up as a leading tech hub.
Disclaimer
The views expressed in this post are those of the authors and do not necessarily reflect the position of the Federal Reserve Bank of New York or the Federal Reserve System. Any errors or omissions are the responsibility of the authors.
 Jason Bram is a research officer in the Federal Reserve Bank of New York’s Research and Statistics Group.
Matthew Ploenzke is a research associate in the Research and Statistics Group.


 RSS Feed
 Follow Liberty Street Economics
In reply to Adam Forman: Regarding the question about our selection of NAICS codes, when one gets into very detailed NAICS designations—more than 4 or 5 digits typically—there are major limitations to data availability from the QCEW (Quarterly Census of Employment and Wages), particularly at the local level. The specific R&D codes 54171 (which we wanted to include) and 541720 (which you question) are subsets of 5417. Because local data was only available consistently at the broader group level (5417), it was not feasible to include one code and not the other. The other NAICS code that you mention, 541712, for “Physical; Engineering; and Life Sciences (except Biotechnology),” is exactly the kind of tech industry we were looking to include. As for 454112, the electronic auctions industry is far too small for employment data to be available at any detailed geographic level—fewer than 10,000 people are employed in that industry nationwide, representing less than 0.01% of all jobs. Because there is no official definition of “tech industries,” selecting an array of NAICS codes is somewhat subjective; however, we feel that the set of codes we included serve as a reasonably good, though admittedly not perfect, proxy for what most people consider to be the “tech sector.”
Questions about NAICS choices: Why were 541712 (R&D Life Sciences) & 541720 (R&D Social Sci) included? Why was 454112 (Electric auctions) excluded?
In reply to RSJ: Thank you for pointing this out, RSJ. You are absolutely correct that a more complete definition of Silicon Valley includes Santa Clara. As an addendum here, we’ve compiled numbers for “Silicon Valley” that include both Santa Clara and San Mateo counties. We find that: • Silicon Valley’s share of private-sector jobs in tech industries rose from 22.7 percent in 2007 to 25.4 percent in 2014 (instead of 14.2 percent to 17.5 percent, without Santa Clara). • Tech job growth in Silicon Valley from 2007-14 was 24 percent (instead of 36 percent, without Santa Clara). It should be noted that these new numbers do not alter the essence of the underlying story and, in fact, even more strongly bolster two of its main points: (1) that Silicon Valley has a much larger tech sector than New York City, and (2) that Silicon Valley’s tech sector has not grown as rapidly, in percentage terms, as those of the urban centers (including New York City). In reply to Heidi: Thank you. We corrected the NAICS code for Scientific R&D Services.
FYI, “Silicon Valley” is both Santa Clara County and San Mateo County, with Santa Clara county being the traditional heart of Silicon Valley as it includes both Palo Alto and San Jose as well as Sunnyvale. It is the home of Xerox Parc (Palo Alto Research Center). Santa Clara county is the headquarters of Apple, HP, Intel, Applied Materials, Advanced Micro Devices, Google, Cisco, Brocade, Nvidia, Vmware, Ebay, Quicken, and Yahoo among others, and, according to your definition, has 250K tech workers (BLS 2014 estimate). Just north of Santa Clara County is San Mateo County that starts in Menlo Park (just north of Palo Alto), grabs East Palo Alto, and goes all the way up to San Francisco County, which is not part of San Mateo county at all. San Mateo County is home to a smaller population and fewer tech jobs that Santa Clara County, but still includes many large companies such as Oracle, Facebook, and Electronic Arts. In other words, you missed 70% of the tech jobs as well as most of the 19,000 startups in Silicon Valley by defining it to be San Mateo County. It would be like an economic growth analysis of NYC by defining the city to be Queens. Santa Clara county is also in a different MSA (but the same CSA). There is San Mateo-Fremont-Oakland and San Jose-Sunnyvale-Santa Clara, so the BLS data is really different.
Typo: should be 5417 in Sci R&D services.