The market for benchmark U.S. Treasury securities is one of the deepest and most liquid in the world. Although trading in the interdealer market for these securities is over-the-counter, it features a central limit order book (CLOB) similar to that found in exchange-traded instruments, such as equities and futures. A distinctive feature of this market is the “workup” protocol, whereby the execution of a marketable order opens a short time window during which market participants can transact additional volume at the same price. With the broadening of the interdealer market to include hedge funds and proprietary trading firms, and the increase in trading activity, some market participants consider the workup to be somewhat of an anachronism that is destined to lose its relevance relative to the CLOB. Contrary to this notion, we document the continued important role played by the workup, show some ways in which trading behavior in the workup has evolved, and explain some of the observed changes.
Explaining the CLOB and Workups
Trading in the interdealer market, especially in the most recently issued (or “on-the-run”) securities, occurs mostly on the BrokerTec and eSpeed trading platforms. Both BrokerTec and eSpeed are electronic limit order markets with no designated market maker. Liquidity supply comes from the CLOB, which is a collection of limit orders at various price levels submitted by the (currently) roughly 150 market participants that are members of the interdealer platforms. When a market order or marketable limit order is submitted, it is matched with one or more limit orders standing on the opposite side in order of price priority, such that the most competitively priced limit orders in the CLOB are matched first.
The execution of a marketable order is just the beginning of a transaction. Once all possible matches of the initial order have been made against depth in the book, the market then enters into a workup process during which additional volume can be transacted at the same price, until there is no further trading interest. The ability to transact additional quantity during the workup enables traders to submit orders of smaller size than their desired quantity, and then expand the order quantity during the workup. Importantly, the limit orders submitted into the workup are fully visible to market participants that can therefore gauge the market interest in transacting at the workup price. The workup protocol, which differs somewhat on the BrokerTec and eSpeed platforms, is discussed in greater detail in this New York Fed staff report.
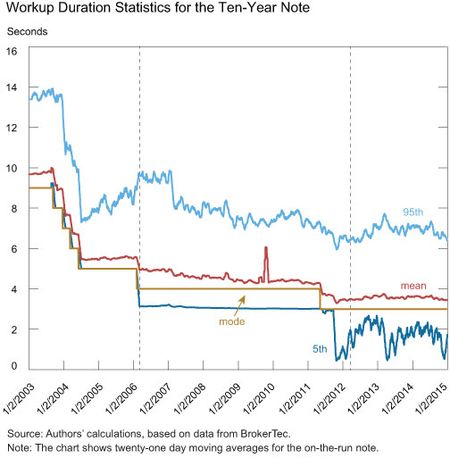
The chart below plots time series of statistics for the duration of the workup on the BrokerTec platform. It shows that the mode (most common) workup length for the on-the-run ten-year note was 9 seconds at the start of 2003 and has generally trended down to just 3 seconds in 2015. In the early years, there was a strict minimum workup length, so that the mode workup length equaled the minimum. In recent years, the protocol has evolved to allow the workup to end early if there is interest in trading at another price.
Trading in the Workup
In 2003-04, trading took place much less frequently on the BrokerTec platform than it does today, and the workup accounted for only about 30 to 40 percent of trading volume in the ten-year note. This changed in early 2006, when the volume share of the workup suddenly rose to about 50 to 60 percent (see chart below). It remained at that level until late 2012, when it rose to its current level of about 65 percent. The pre-2012 numbers are consistent with those reported in this paper, and the evolution since then is a clear illustration of the continued relevance of the workup mechanism.
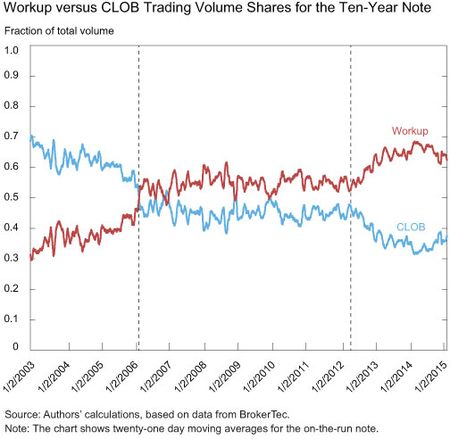
While the reasons for the two sharp increases in the workup volume shares are not known for sure, it’s notable that the changes coincided with major upgrades to the BrokerTec trading platform, on March 27, 2006, and March 26, 2012. In each case, the upgrades significantly reduced the latency (elapsed time) associated with the transmission and processing of messages by the matching engine and improved real-time market data feeds. These technology improvements may have facilitated the introduction of more sophisticated automated trading strategies that were already prevalent in equity markets by 2006, but that remained comparatively uncommon in the Treasury market. Such strategies are now commonplace in the trading of on-the-run Treasury securities, as discussed in a recent white paper issued by the Treasury Market Practices Group and a recent report on the October 15, 2014, flash rally.
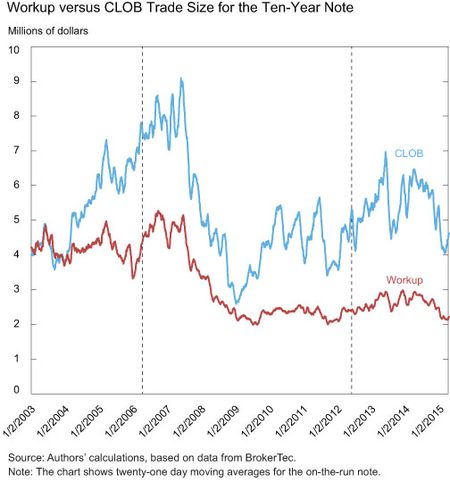
One sign of the changing trading patterns in the workup is seen in the next chart, which shows the average transaction size for the ten-year note dropping from $5 million between 2003 and 2006 to around $2 million after 2009. This pattern stands in contrast to the transaction sizes of CLOB trades, which also dropped during the financial crisis but increased between 2005 and 2007 and post-2008.
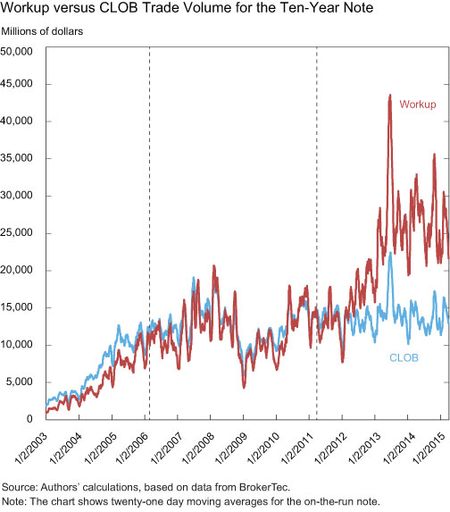
At the same time, the volume of workup trading grew significantly post-2012, while the volume of CLOB trading leveled off at pre-crisis levels, reflecting the increased frequency of workup trades.
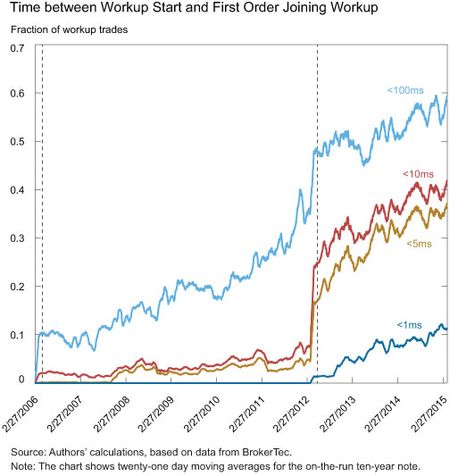
The effect of technology improvements is also apparent in the last chart, which shows the evolving distribution of the time between the start of the public phase of the workup and the first order (passive or aggressive) joining the workup. In 2006, less than 10 percent of workups had orders joining the workup within 100 milliseconds (ms) (a rough upper bound on the fastest reaction time of a human trader), but by late 2011, this figure had increased to about 33 percent of workups. By contrast, orders joining within 5 to 10 ms were rarely seen before 2012 (less than 3 percent of workups), and orders joining within 1 ms essentially never happened. This changed dramatically with the technology upgrade in 2012, when the share of workups with orders joining within 5 to 10 ms jumped to 20 percent. The figure has since increased to around 33 percent. Even more remarkable, the share of orders joining within 1 ms rose from 0 percent to 2 percent and has since increased to about 10 percent. This provides a clear illustration of how improvements in technology have promoted automation and speed of trading in the Treasury market.
Concluding Remarks
The workup is a unique feature of the interdealer cash Treasury market. Over time, the details of the workup have changed in response to changing market conditions, with the abandonment of the private phase
and the shortening of the default duration to 3 seconds. While some market participants may consider it an anachronism, given the increased trading activity in benchmark Treasuries and the tight link to the extremely liquid Treasury futures market, the workup has not only remained an important feature of the interdealer market; it has actually grown in importance, now accounting for almost two-thirds of trading volume in the benchmark ten-year Treasury note.
Disclaimer
The views expressed in this post are those of the authors and do not necessarily reflect the position of the Federal Reserve Bank of New York or the Federal Reserve System. Any errors or omissions are the responsibility of the authors.

Michael J. Fleming is a vice president in the Federal Reserve Bank of New York’s Research and Statistics Group.

Ernst Schaumburg is an assistant vice president in the Federal Reserve Bank of New York’s Integrated Policy Analysis Group.

Ron Yang is a senior research analyst in the Bank’s Research and Statistics Group.


 RSS Feed
 Follow Liberty Street Economics