Securities brokers and dealers (“dealers”) engage in the business of trading securities on behalf of their customers and for their own account, and use their balance sheets primarily for trading operations, particularly for market making. Total financial assets of dealers in the United States have not shown any growth since 2009. This stagnation in their balance sheets raises the worry that dealers’ market-making capacity could be constrained, adversely affecting market liquidity. In this post, we investigate the stagnation of dealer balance sheets, focusing particularly on the boom and bust of the housing market.
Dealer Balance Sheet Growth Has Stagnated
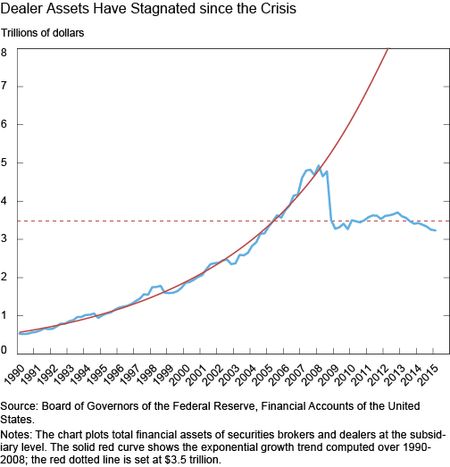
A priori, we would expect the size of dealer balance sheets to expand exponentially over time, similar to GDP or population. The chart below shows dealer balance sheet size in dollar amounts since 1990. Dealer size grew exponentially from 1990 through 2008, with a peak close to $5 trillion. Dealer assets then collapsed after the Lehman failure and remain stalled at around $3.5 trillion, the level of 2005 (indicated by the red dotted line in the chart). If the previous trend growth had continued (indicated by the solid red line), dealer balance sheet size would be more than three times larger than it is today.

The stagnation of dealer size since the crisis raises the question of whether the $5 trillion dollar peak was excessive, whether the exponential pre-crisis growth was sustainable, and whether the current level is, in some sense, depressed. To address these questions, we consider three factors that may have affected dealer balance sheet size in recent years: regulation, the housing boom and bust, and electronification.
Recent Regulatory Changes or Dealer Risk Appetite?
Regulations affecting the broker-dealer sector have tightened markedly since the financial crisis. While the five major independent U.S. dealers were outside of the safety net prior to the financial crisis and regulated under Basel II capital rules, all of them have either failed (Lehman), been acquired by banking organizations (Bear Stearns and Merrill Lynch), or become Bank Holding Companies themselves (Goldman Sachs and Morgan Stanley). All major U.S. dealers are now subject to the Federal Reserve’s stress tests and enhanced capital and liquidity requirements, as well as more stringent Basel III rules. One possibility, put forward by commentators, is that increased regulatory scrutiny is causing the stagnation of dealer balance sheets, which in turn has adversely affected market liquidity.
Establishing a causal relationship between regulation and dealer balance sheets is challenging because dealers continuously adjust the size and composition of their balance sheets during the normal course of business. Recent research (Adrian and Shin 2014) suggests that dealers expand their balance sheets in booms and contract them in busts, primarily by adjusting leverage. This behavior is indicative of dealers’ risk appetite, since (other things equal) higher leverage mechanically exposes dealers to more risk by amplifying potential losses. It is therefore not uncommon to see dealers rationally deleverage during downturns as potential losses are realized.
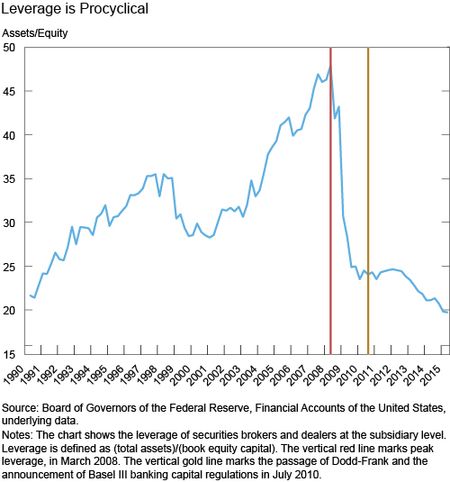
The next chart shows that the private incentives of dealers to deleverage and the social incentives of regulators to impose limits on leverage coincided in the wake of the housing boom and bust. The vertical red line indicates peak leverage of 48 in the first quarter of 2008, just prior to the near failure of Bear Stearns. Within 15 months, leverage dropped to 25. The vertical gold line marks the passage of Dodd-Frank and the announcement of Basel III banking capital regulations in July 2010. Since then, leverage has continued to gradually decline.

On the one hand, most dealer deleveraging occurred prior to the announcement of potentially constraining regulation, suggesting post-crisis dealer balance sheet contraction is largely attributable to a decrease in dealers’ risk appetite. On the other hand, while Dodd-Frank and Basel III regulations may help explain the moderate deleveraging since 2010, it is unclear to what extent regulations constrain growth in dealer leverage and risk-taking today, over and above a lingering lack of risk appetite.
Aftermath of the Housing Boom and Bust
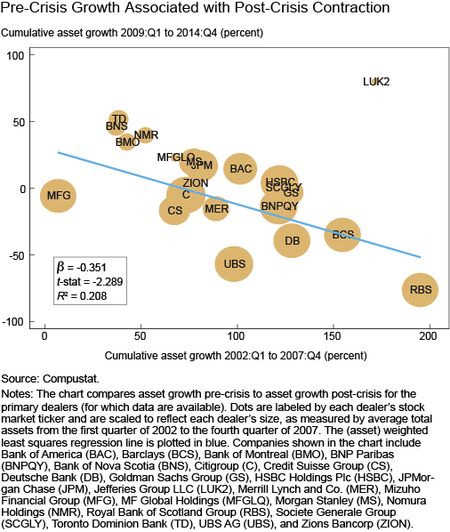
To further investigate the effect of risk aversion on dealer balance sheet contraction, we examine whether the cross section of dealers’ risk-taking behavior during the housing boom shaped their growth in the subsequent housing bust. In the chart below, we show that dealers that expanded their balance sheets more in the run-up to the crisis (2002-2007) tended to contract their balance sheets more after the crisis (2009-2014). This finding is a cross-sectional version of the procyclicality of dealer balance sheets documented by Adrian and Shin.

We further investigate the cross section of risk-taking, using the realized volatility of equity returns over the pre-crisis period as a measure of risk-taking. We find that riskier dealers tended to have larger losses during the crisis, as shown in the next chart. A related academic study shows that the propensity to take risk across firms persists over time.
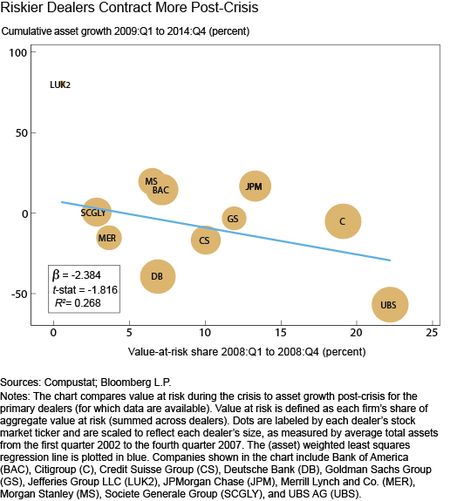
Furthermore, larger risk-taking during the crisis—as measured by dealers’ VaR (value at risk)—predicts greater contraction of assets post-crisis, as shown below. These findings are consistent with the interpretation that dealers’ propensity to take risk amplified the growth of dealer balance sheets going into the crisis, causing crisis losses and a subsequent sharp contraction of balance sheets post-crisis.

This evidence is suggestive of balance sheet contraction being related to dealers’ risk-taking behavior in the run-up to the crisis. In particular, many European banking organizations aggressively entered the U.S. investment banking market in the late 1990s and early 2000s, fueling the increase in aggregate balance sheet size. Furthermore, many major dealers aggressively expanded their securitization activities and holdings of securitized assets. Both factors likely increased balance sheet growth pre-crisis, and both factors are (cross-sectionally) associated with losses during the crisis and balance sheet reduction post-crisis.
Role of Electronification
Electronification refers to the trend toward trading though computer systems, the increasing use of automated trading (which relies on algorithms for trading decisions and executions), and the reliance on speed to identify and act upon trading opportunities (that is, high-frequency trading). The growing role of electronic trading has likely narrowed bid-ask spreads and reduced dealers’ profits from intermediating customer order flow, causing dealers to step back from making markets and reducing their need for large balance sheets. The changing competitive landscape of market making, as manifested by the entry of nondealer firms since the early 2000s, may therefore also play a role in the post-crisis dealer balance sheet dynamics.
In Sum
The picture that emerges is that post-crisis dealer asset growth represents the confluence of several issues. Our findings suggest that business-cycle factors (the hangover from the housing boom and bust and subsequent risk aversion) and secular trends (electronification and competitive entry) should be considered alongside tighter regulation in explaining stagnating dealer balance sheets.
Disclaimer
The views expressed in this post are those of the authors and do not necessarily reflect the position of the Federal Reserve Bank of New York or the Federal Reserve System. Any errors or omissions are the responsibility of the authors.

Tobias Adrian is a senior vice president and the associate director of the Federal Reserve Bank of New York’s Research and Statistics Group.

Michael J. Fleming is a vice president in the Group.


 RSS Feed
 Follow Liberty Street Economics
Tom, we used the items “Equity Capital” and “Total Assets” from the “Underlying data” to the Z1 release. You can find the data here using the Board of Governors’ data download program: http://www.federalreserve.gov/datadownload/Choose.aspx?rel=Z1
Chris, thank you for your comment. Your thought about RBS had occurred to us, so we ran separate regressions excluding RBS. Though the results are statistically weaker without RBS (t-stat of -1.247 vs. -2.289 in the third figure, and -1.665 vs. -2.597 in the fourth figure), the slope coefficients are similar (-0.212 vs. -0.351, and -1.461 vs. -1.431, respectively). This gives us confidence that our results do not depend critically on the inclusion of RBS. From an economic standpoint, RBS is a particularly stark example of a European bank that expanded in the U.S. market pre crisis, generated large losses, and scaled back its balance sheet tremendously after the crisis.
A question for the authors: how did you calculate leverage for the dealers from the Financial Accounts of the U.S.? More specifically, since assets (the numerator) is fairly straightforward, how did you calculate book equity (denominator)? The notes mention underlying data.
Thank you for the interesting series of blog posts. In the “Riskier Dealers had Bigger Crisis Losses” graph/regression, it appears that RBS is an important leverage point. The highlighted risk/loss relationship may not hold if RBS is removed from the population. Perhaps the facts of RBS’s circumstances support your hypothesis and it proves the rule? RBS has a similar, but less dramatic effect in the “Pre-Crisis Growth Associated With Post-Crisis Contraction” graph/regression as well. The role RBS plays in the analysis does bear some investigation and comment.