In March, the Federal Reserve and thirty-one large bank holding companies (BHCs) disclosed their annual Dodd-Frank Act stress test (DFAST) results. This is the third year in which both the BHCs and the Fed have published their projections. In a previous post, we looked at whether the Fed’s and the BHCs’ stress test results are converging in the aggregate and found mixed results. In this post, we look at stress test projections made by individual BHCs. If the Fed’s projections are very different from a BHC’s in one year, do the BHC projections change in the following year to close this gap? Or are year-to-year changes in BHC stress test projections driven more by changes in underlying risk factors? Evidence of BHCs mimicking the Fed would be problematic if it meant that the BHCs are not really independently modelling their own risks. Convergence poses a potential risk to the financial system, since a financial system with monoculture in risk measurement models could be less stable than one in which firms use diverse models that collectively might be more likely to identify emerging risks.
Persistence over Time
As a first step, we look at the correlation in BHC stress test projections over time, asking whether a BHC’s stress test projections are more highly correlated with its own lagged projections or with the Fed’s previous projections. Specifically, we estimate the following equation:

where Yi,tBHC is BHC i’s projection of some stress test variable for year t, Yi,tFED is the Fed’s projection of that variable for BHC i in year t, and ϒt is a dummy variable for each year t. The coefficients βBHC and βFED measure the correlation between the BHCs’ projections in year t and the BHCs’ and Fed’s projections in year t-1, respectively. This equation essentially creates a “horse race” to identify whether the BHCs’ projections are more correlated with their past projections or with the Fed’s. A finding that the Fed’s lagged projections mattered more would be consistent with the idea that the BHCs are trying to mimic the Fed’s stress test results. We estimated the equation using data from all DFAST BHCs between 2013 and 2015, but since we have lagged variables on the right-hand side, the dependent variables are based on 2014 and 2015 data.
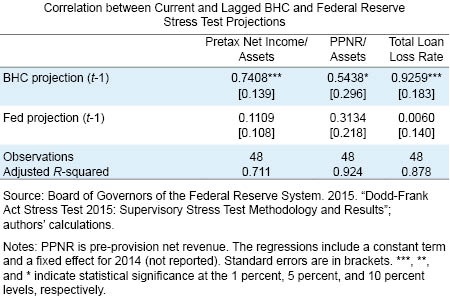
The table below presents the results of these estimates for three important variables in the severely adverse macroeconomic scenario: pre-tax net income, pre-provision net revenue, and total loan losses, all scaled by total assets or total loans. The results indicate that the BHCs’ projections are significantly correlated with their own past projections, but not with the Fed’s; the coefficients on the lagged BHC projections are all positive and statistically significant, while the coefficients on the lagged Fed variables are much smaller and are statistically insignificant.
Closing the Gap?
These results suggest a relatively high degree of persistence in the BHCs’ projections, similar to the persistence in the Fed’s projections found by Glasserman and Tangirala. We therefore look to see if the change in the BHCs’ forecasts in a given year is associated with the gap between the BHC’s and Fed’s projections the year before; that is, if the Fed’s projection of net income, PPNR, or losses is much higher than a BHC’s, does the BHC’s projection tend to increase in the following year? Or are year-over-year changes more strongly related to factors such as changes in condition or risk at the BHC or changes in the macroeconomic scenario envisioned in each stress test, as one would hope?
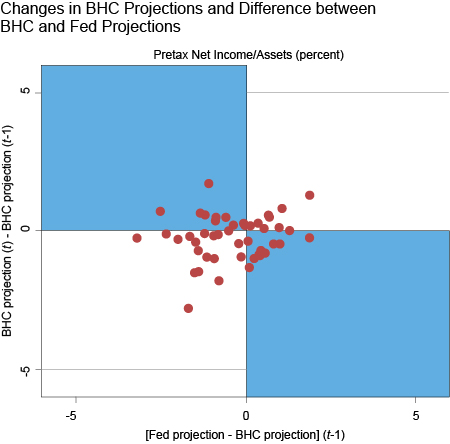
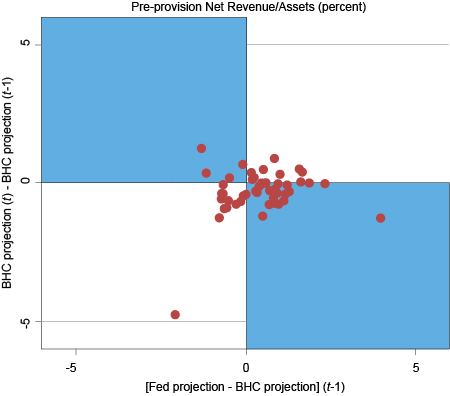
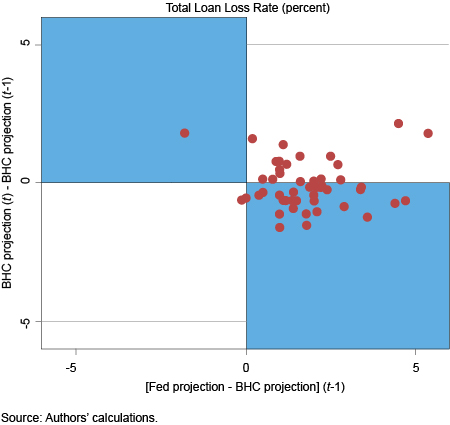
The three charts plot the change in the BHCs’ projections of net income, PPNR, and total loan losses against the difference between the Fed’s and the BHCs’ projections of these variables in the previous year. If the BHCs were attempting to mimic the Fed’s results, we would expect a positive correlation between these two variables. At the extreme, all points would be in non-shaded regions along the 45 degree line, indicating a one-for-one change in BHC projections to close the Fed–BHC gap. Instead, we see many points in the shaded regions of charts. For example, for loan loss rates, when the Fed has higher loan loss rate forecasts than the BHC, BHCs actually have lower loss projections in the next year almost half of the time (these are the points in the lower right-hand quadrant of the chart).
The table below goes further by presenting results from a regression that controls for other factors that could affect how projections change from year-to-year:

where ΔYi,tBHC and ΔYi,tFED are the changes in BHC i’s and the Fed’s projection of variable Y between year t and year t-1, and Yi,t-1BHC and Yi,t-1FED are the BHC’s and Fed’s projections of stress test variable Y in year t-1. The sign of βGAP indicates how changes in a BHC’s projection relate to the gap between the Fed’s and the BHC’s projections the year before; a positive sign is consistent with mimicking. The equation includes the change in the Fed’s projection from between year t and year t-1 to control for other factors affecting the projections, such as changes to the macroeconomic scenario or the risk profiles of the firms.
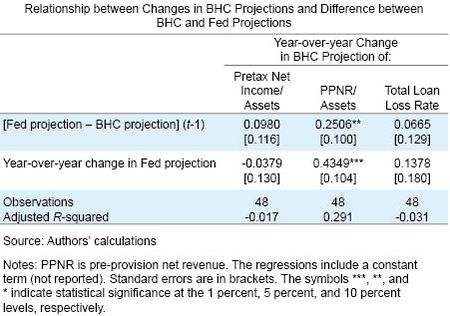
The findings are mixed. For pre-tax net income and the total loan loss rate, the lagged gap in Fed versus BHC projections is not significantly related to the change in BHC projections the following year. For PPNR, however, there does appear to be a significant relationship, with a higher gap associated with increases in PPNR in the following year.
Notably, there is also little evidence that the changes in BHC projections are correlated with changes in the Fed projections, our control for changes in underlying risk exposures, and other factors that could affect the projections; only the BHCs’ PPNR projections are correlated with the change in the Fed’s projections.
Is the Glass Half Full, or Half Empty?
As with our earlier aggregate results, we find mixed evidence at the individual BHC level on whether BHCs’ stress test projections are converging toward the Fed’s. Schuermann has pointed out that BHCs have incentives to imitate the Fed’s stress test models. We observe convergence in some areas but not in others—a mixed message for those concerned about model monoculture. We do see some convergence in revenue projections; BHC’s forecasts move closer to what the Fed projected in the previous year. However, little of the explanatory power in the regression comes from the gap between the BHC and Fed’s prior year forecast.
By contrast, the BHCs seem to be sticking to their own models for loan losses, with projections that are closer to their own prior projections than the Fed’s. Nor did we find any evidence of convergence in pretax net income, the ratio that matters most to capital, and hence, to solvency.
Disclaimer
The views expressed in this post are those of the authors and do not necessarily reflect the position of the Federal Reserve Bank of New York or the Federal Reserve System. Any errors or omissions are the responsibility of the authors.
Angela Deng is a senior research analyst in the Bank’s Research and Statistics Group.
 Beverly Hirtle is a senior vice president in the Federal Reserve Bank of New York’s Research and Statistics Group.
Anna Kovner is an assistant vice president in the Bank’s Research and Statistics Group.


 RSS Feed
 Follow Liberty Street Economics