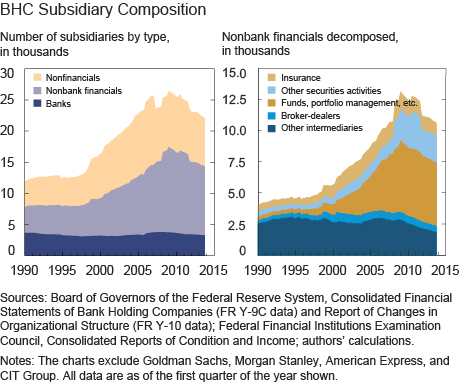
Correction: We revised the left panel of the chart “BHC Subsidiary Composition” on March 16, 2016, to update the number of “Nonfinancial” firms. This figure was understated in the original version of the chart. We regret the error.
When we think of banks, we typically have in mind our local bank branch that stores deposits and issues mortgages or business loans. Prima facie there is nothing wrong with this image. After all, there are still almost 6,000 unique commercial banks in the United States that specialize in deposit-taking and loan-making; when we include thrifts and credit unions, this number more than doubles. What we typically forget, however, is that most commercial banks are subsidiaries of larger bank holding companies (BHCs), and in fact nearly all commercial bank assets fall under such BHCs. This post presents a first in-depth analysis of the evolving organizational structure of U.S. bank holding companies over the last twenty-five years. We present a unique new database that details BHC structure at a level previously unavailable in any systematic way.
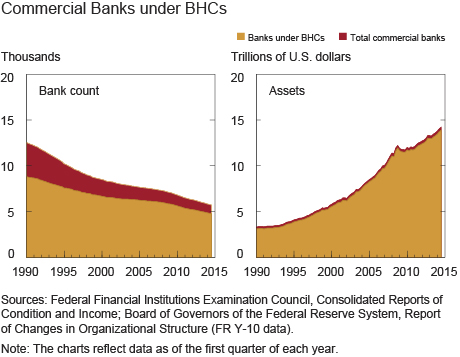
The two charts below formalize the description in the previous paragraph. The left panel shows the total number of commercial banks (gold plus red) and the proportion of those banks under BHCs (gold only). The right panel shows the equivalent breakdown, but measured in terms of total assets. This organizational feature of the industry raises a slew of questions: What are the boundaries of a modern banking firm? Are BHCs simply containers of diverse financial entities that include commercial banks? Do traditional commercial banking activities (such as maturity transformation, liquidity services, and credit extension) extend to a wider range of financial firms owned by the same BHC? Most importantly, how should we rethink our working definition of a bank (now a BHC?), and what are the implications of shifting organizational scope?
Recent research by Federal Reserve Bank of New York economists on the evolution of financial intermediation over the last thirty years, specifically on large and complex banks, documents the progressive transformation of the industry from banks to increasingly complex financial conglomerates. Economists found that while financial intermediation shifted from relatively simple, traditional deposit-taking and lending to more complex chains of intermediation associated with shadow banking, banks evolved in step by incorporating these new entity types under common ownership. Thus, large banks remained at the center of these new markets and modern intermediation.
Meet a New Database
We have assembled a complete, time-consistent panel of all existing BHCs since 1990. For each organization, we know all of its subsidiaries, its business activities, and the organizational structure within the BHC (in other words, who owns what at each branch of the organizational tree). We also have entry and exit records telling us whether new subsidiaries were created de novo or were acquired, and whether exiting subsidiaries or whole BHCs were sold or simply liquidated.
As for business activity, we know each subsidiary’s primary (and secondary, if applicable) activity based on its six-digit NAICS code classification. For instance, within credit intermediation (NAICS 522), we can determine whether a BHC owns nondepository specialty lenders such as automobile finance leasing companies (NAICS 522220) or credit card issuers (NAICS 522210) alongside traditional commercial banks (NAICS 522110). Furthermore, we can differentiate financial subsidiaries such as broker-dealers (NAICS 5231), insurance underwriters (NAICS 5241), insurance brokers (NAICS 5242), and portfolio managers (NAICS 52392). Analysis at this fine level of disaggregation greatly improves our understanding of BHCs’ specialization and sector expansion. Finally, the data set allows us to unpack complex chains of nested subsidiaries and distinguish horizontal conglomerates from vertical conglomerates.
This incredible wealth of information is collected in regulatory forms that all U.S. BHCs file. Similar to the Securities and Exchange Commission’s 10-K filing, the Federal Reserve’s form FR Y-6 is the means by which BHCs file their annual reports. Each of these reports contains a subsidiary organizational chart, and it is these charts that form the foundation of this new data set. In addition, when a BHC changes its organizational structure, it must file form FR Y-10; we use these forms to update BHC structure. This information has been collected by the Federal Reserve System since the implementation of the Bank Holding Company Act of 1956, but it has never been consolidated systematically until now. You can get an idea of the information available by visiting the National Information Center (NIC) database, which details individual BHC structure. However, the publicly available NIC database provides only a subset of the rich panel that we have successfully assembled.
With these new data, we can characterize the evolution of BHCs and offer fundamental insights into their internal “plumbing.” Since small BHCs have very simple structures, we focus on BHCs with at least $150 million in total assets. We start with a simple, aggregate portrayal of BHCs’ subsidiary composition and its evolution over time. The left panel below shows that, despite their name, BHCs have owned more than just commercial banks throughout the entire period. Early on, nonbank financial subsidiaries and nonfinancial subsidiaries accounted for about half of all subsidiaries. However, their presence has exploded over the past twenty-five years, while the number of commercial bank subsidiaries has stagnated. From 1990 until the financial crisis hit in 2008, the number of subsidiaries grew by 150 percent, driven solely by nonbank sectors.
Zooming in on nonbanking financials in the right panel, we see the predominance of specialty lenders (“Other intermediaries”) and the emergence of brokers and dealers during the 1990s, followed by growth in insurance and tremendous expansion of asset management (“Funds, portfolio management, etc.”) in the following decade.
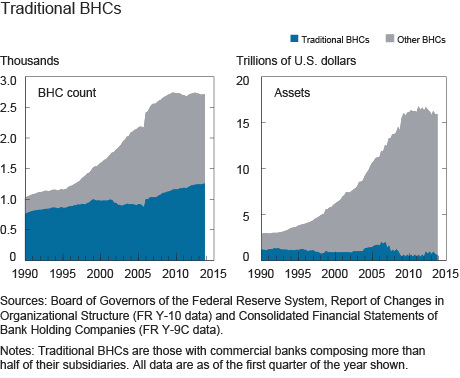
These aggregate representations conceal considerable heterogeneity in organizational structure across BHCs. To get a sense of the diversity, we define traditional BHCs as those with commercial banks composing more than half of their subsidiaries. In 1990, of approximately 1,000 organizations with more than $150 million in assets, about 800 qualified as traditional BHCs. This proportion progressively diminished over time so that now fewer than half of such BHCs can be classified as traditional (left panel below). The right panel shows that traditional BHCs are disproportionately smaller in terms of assets and became more so over time.
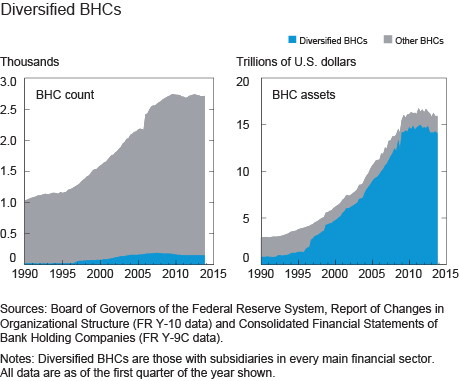
By contrast, we define diversified BHCs as those with subsidiaries in every main financial sector (depository institutions, specialty lenders, brokers and dealers, insurance, and asset management). Previous research found that BHCs incorporated subsidiaries in these categories to accommodate modern credit intermediation chains. This is apparent in the two charts below, which show that the number of diversified BHCs grew from just a handful in 1990 to about 150 at the peak in 2009 (left panel). BHC assets (right panel) reveal the striking rise of this new, diversified model of financial intermediation.
Subsidiary Entry and Exit Flows
Along with cross-sectional composition, we can use subsidiary entry and exit information to understand the dynamic process whereby BHCs transform into more complex organizations. The chart below shows the number of subsidiaries that enter and exit BHCs in any given quarter (bars above zero denote entries and darker bars below zero denote exits). For instance, the light gold bars show that BHCs added depository institutions throughout the 1990s, but that this expansion slowed over time. Simultaneously, the corresponding dark gold bars below show that exit of depository institutions from BHCs has in fact been larger than entry throughout the entire sample period.
Outside of depository institutions, the 1990s were years of both significant growth and meaningful turnover for specialty lenders (red bars). In asset management, entry growth began in the mid-1990s while exit remained subdued; since the financial crisis, asset management has seen considerably more exit (green bars).
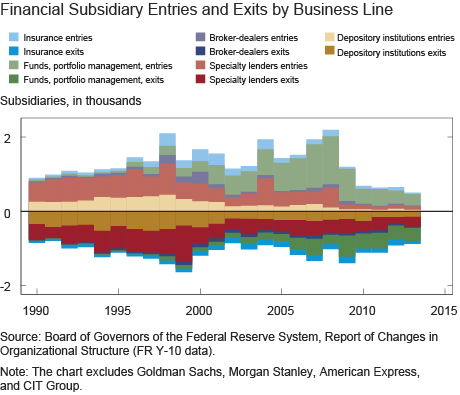
Some of the entry rates (where the rate is defined as the flow above divided by the corresponding number of entities in existence) are even more telling: the average entry rate for both specialty lenders and broker-dealers was a significant 5 percent throughout most of the 1990s. Broker-dealer growth even accelerated, to a whopping average of 15 percent for the three years beginning in 1998. Likewise, the number of asset managers grew 10 percent on average between 1995 and 2005, while the number of insurance entities grew 6 percent over the same period.
These trends suggest that a significant transformation is under way in the financial industry. We have still just scratched the surface of this new database, yet we believe that further refinement will help answer fundamental questions about the structural transformation of this crucial sector of the economy: What is driving changes in the organizational structure of BHCs? Are there environmental factors—regulatory changes, industry innovation, the macroeconomic cycle—behind the observed transformations? Who are the “innovators” and the “followers” in this evolution and do these groups interact? And what does changing financial organizational structure mean for future performance, growth, or risk? How does the structure of the parent holding company affect the conduct of its subsidiaries? As engrossed as we are by the trends above, the true power in this new data set lies in what remains unexplored.
Disclaimer
The views expressed in this post are those of the authors and do not necessarily reflect the position of the Federal Reserve Bank of New York or the Federal Reserve System. Any errors or omissions are the responsibility of the authors.
![]() Nicola Cetorelli is an assistant vice president in the Federal Reserve Bank of New York’s Research and Statistics Group.
Nicola Cetorelli is an assistant vice president in the Federal Reserve Bank of New York’s Research and Statistics Group.
Samuel Stern is a senior research analyst in the Group.


 Nicola Cetorelli and Samuel Stern
 RSS Feed
 Follow Liberty Street Economics
Chris: Thank you for your comment and for showing interest in the database. I am not able to predict at this point as to whether we will be able to make the data available, and if so under what limitations and constraints. If we ever do rest assure it will be broadly advertised.
Well, Street guys have been doing this work for at least twenty years, so a review of claims of “first” and “new” is in order. Nevertheless, it is good to see pro economists now doing it.
This is very exciting work! Is the Federal Reserve willing to make the enriched dataset or code used to create it available to the public? These data have great value to risk and finance practitioners and academic researchers. My colleagues and I have spent thousands of hours working with Call Report and FR Y-9C data. The FR Y-9C data in particular are challenging to use due to the organizational structure of BHCs and the changes over time. It sounds as though the enhanced data panel you have constructed would lower the barriers to effective use of these data in a revolutionary way. Thank you for sharing the results of your research. I encourage you to open your data and methods to others who could use it to rigorously analyze the evolving financial landscape and manage risk.