The risk of becoming unemployed varies substantially across different groups within the labor market. Although the “headline” unemployment rate draws the most attention from the news media and policymakers, there is rich heterogeneity underlying this overall measure. We delve into the data to describe how unemployment and job loss risk vary with demographics (gender, age, and race), skill (educational attainment), and job characteristics (occupation and earnings).
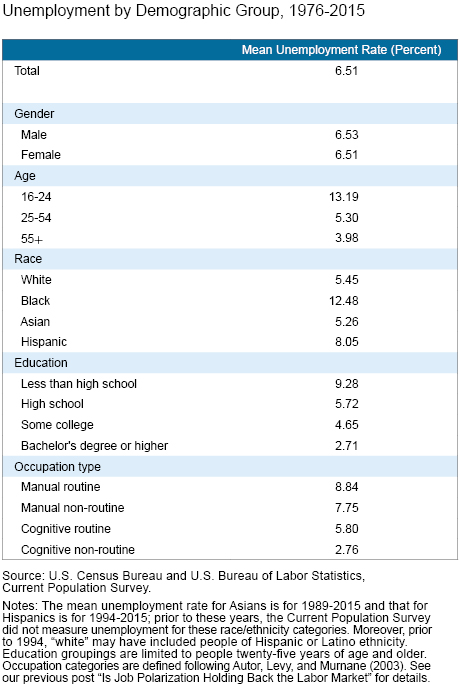
Differences in unemployment across these groups are long-standing. The table below shows the average unemployment rate for various demographic, skill, and occupation groups in the labor force since 1976. Workers who are younger or less educated, workers in manual occupations, and workers who identify as Black or Hispanic experienced significantly higher average unemployment rates than college educated and older workers.
To better understand the impact of unemployment on households, it is important to establish whether these differences are related to differences in the incidence of unemployment or the duration of unemployment. Frequent but short spells of unemployment might have different consequences for well-being than less frequent but longer spells of unemployment. To examine this issue, we plot in the chart below the average job-loss rates and unemployment durations across individuals within different groups of the labor force over the same period.
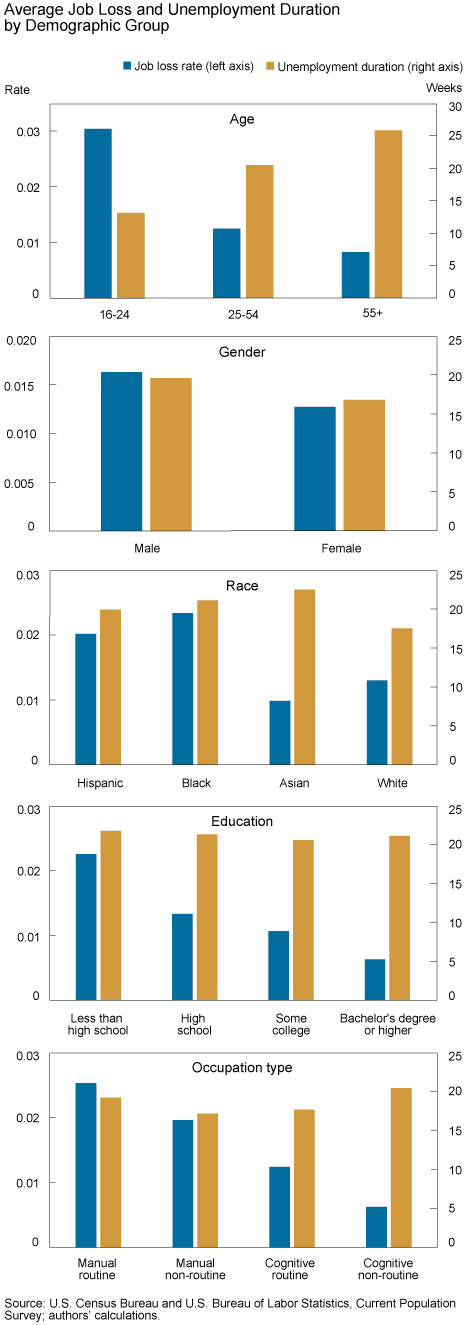
Even though male and female workers have similar unemployment rates, men are more likely to lose their jobs during recessions because they are more likely to work in cyclically sensitive sectors such as construction and manufacturing. Job loss rates are also both higher and more cyclical for young workers and less educated workers. However, duration of unemployment follows a different pattern. Even though young workers have higher risk of unemployment, they face much shorter unemployment spells. Job loss is less likely for older workers, but if they lose their jobs, they tend to experience longer jobless spells.
Perhaps the most interesting pattern emerges with education groups. Job loss rates decline predictably as educational attainment increases, but duration of unemployment is very similar across education groups. This pattern was evident in the Great Recession, when the unemployment rate increased much more for less educated workers but unemployment durations were very similar—a sign of greater occupational “mismatch” for more educated workers.
These stark differences across labor force groups carry over to the changes in unemployment during recessions and recoveries. The period from 1976 to 2015 includes five cycles of recession and recovery. The first column of the table below reports the ratio of the average rise in each group’s unemployment rate to the rise in the overall unemployment rate for the last five downturns using data from the Current Population Survey (CPS). If the rise in unemployment were spread uniformly across different subgroups of the labor market, the ratios in the table would all equal 1. However, we again find that workers who are male, younger, or less educated, as well as workers in manual occupations and individuals from ethnic minorities, experienced steeper rises in joblessness during all recessions, including the most recent one.
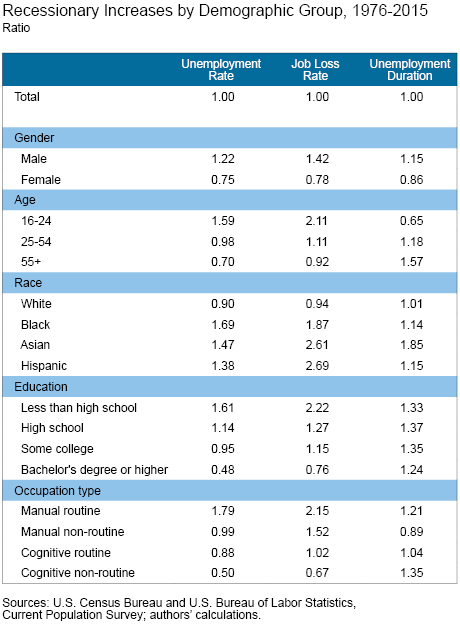
The measures of unemployment risk among labor force groups yield an important message on the sources of disparate trends in unemployment across labor force groups. Namely, the measures show that in this and in previous downturns, joblessness is driven predominantly by differences in job loss rates across these groups. In sharp contrast, the duration of unemployment is much more uniform.
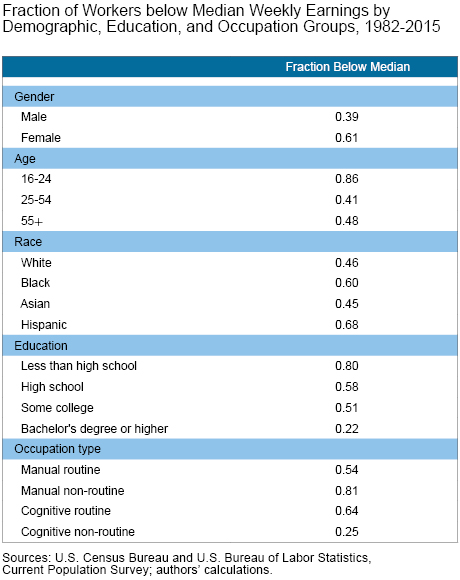
Groups that are subject to higher unemployment risk are also the ones that are less able to insure themselves since they typically earn less. The next table shows the fraction of workers below median weekly earnings by demographic, education, and occupation groups. Female workers, workers who are younger or less educated, workers who identify as Black or Hispanic, and workers in manual jobs are much more likely to be earning below the median.
Another way to illustrate the unevenness of unemployment risk is to group workers by their earnings. The chart below shows the observed probability, for the 1982-2015 period, that employed persons in different weekly earnings quintiles will become unemployed within a year. Over the period, workers with lower earnings were more likely to become unemployed. A portion of this trend reflects differences between part-time and full-time workers. Part-time workers generally have lower weekly earnings, and the lower stability of part-time jobs results in higher job loss rates, exacerbating the negative relationship between earnings and job loss rates. However, the differences between part-time and full-time workers cannot fully explain the trend; even for full-time workers, lower wages are associated with higher job loss rates. These findings illustrate the precarious position of low-wage workers: not only do they earn less when employed, but they are also more likely to lose their jobs.
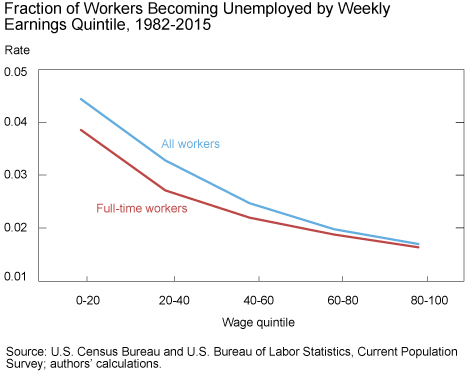
These patterns, which also appear in comprehensive social security data on earnings, have important implications for policy. Aggregate stabilization policies that aim for maximum employment would be especially helpful for demographic groups that face a higher and more cyclical risk of unemployment.
Disclaimer
The views expressed in this post are those of the authors and do not necessarily reflect the position of the Federal Reserve Bank of New York or the Federal Reserve System. Any errors or omissions are the responsibility of the authors.

Benjamin Pugsley is an economist in the Federal Reserve Bank of New York’s Research and Statistics Group.
 Rachel Schuh is a research analyst in the Bank’s Research and Statistics Group.

Ayşegül Şahin is a vice president in the Bank’s Research and Statistics Group.


 RSS Feed
 Follow Liberty Street Economics