The dollar rose sharply against both the euro and yen in 2014 and 2015 and non-oil import prices subsequently fell. An explanation for this relationship is that a stronger dollar reduces the dollar-denominated cost of producing something in Germany or Japan, giving firms room to lower their dollar prices in order to gain sales against their U.S. competitors. A breakdown by type of good, however, shows that import prices for autos, consumer goods, and capital goods tend not to move much with changes in the dollar as foreign firms choose to keep the prices of their goods stable in the U.S. market. Instead, the connection between import prices and the dollar largely reflects the tendency for commodity prices to fall in dollar terms when the dollar strengthens. As a consequence, the dampening effect of a stronger dollar on U.S. inflation is transmitted much more through falling commodity prices than through cheaper imported cars and consumer goods.
The Dollar and Non-Oil Import Pricing
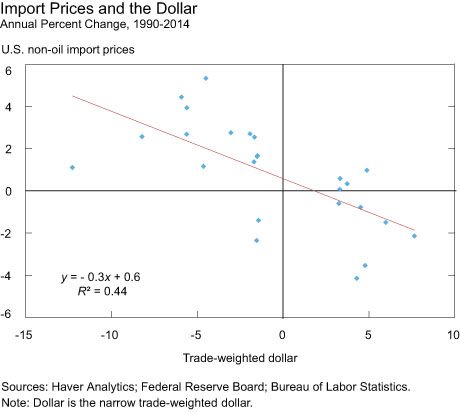
The chart below illustrates the correlation between changes in the dollar and changes in the index of non-oil import prices (both in percentage terms), using annual data starting in 1990. The regression line implies that import prices tend to fall 3.2 percent for every 10 percent appreciation of the dollar, similar to the 3.8 percent estimate in the New York Fed’s trade model.
Breaking down the price index into industrial supplies, capital goods, consumer goods, and autos reveals significantly different responses. We estimate that a 10 percent rise in the dollar correlates with only a 1 percent drop in the import price indexes for autos and consumer goods and a 2 percent decline in the index for capital goods. This implies that foreign firms keep the dollar prices for such goods in the U.S. market relatively stable regardless of dollar movements. As a result, a stronger (weaker) dollar boosts (shrinks) their profits as the revenue from sales in the U.S. market gets converted back into their own currency.
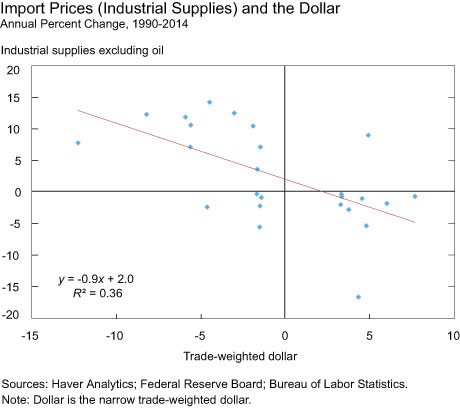
By contrast, we estimate a 9 percent decline in the price index for industrial supplies with a 10 percent rise in the dollar (see chart below). Firms selling these commodity-like goods face very different pricing decisions than an automaker, since commodity prices are determined on global markets.
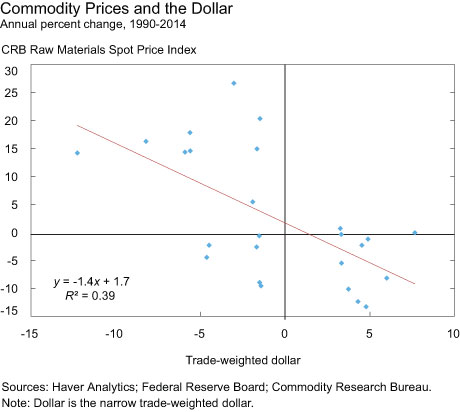
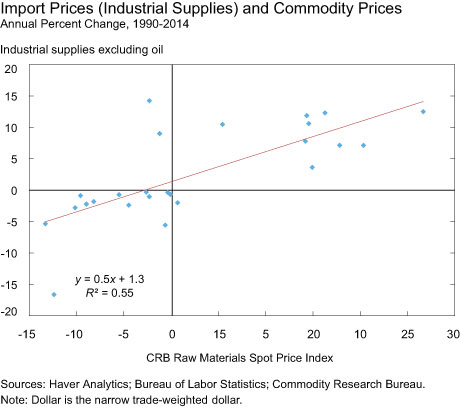
This relationship could reflect that a stronger dollar raises commodity prices in foreign currency terms. The higher foreign currency price of commodities seen abroad works to lower demand for these goods, resulting in a lower dollar price. The chart below plots the changes in the dollar index against changes in the Commodity Research Bureau’s raw industrials price index (both in percentage terms), which includes various metals, cotton, rubber, wools, leather, and other items. The regression has a 10 percent rise in the dollar index correlated with a 14 percent drop in this commodity price index. The following chart completes the picture by showing that a 10 percent rise in this commodity price index is correlated with a 5 percent increase in the industrial supplies import price index.
The final chart illustrates how volatile import prices of industrial supplies are, relative to import prices of autos and consumer goods. (The dollar is inverted so that it moves in the same direction as import prices.) The swings in the dollar are fairly well matched by changes in import prices of industrial supplies, while import prices for autos and consumer goods do not move much at all, something that is particularly evident in the dollar’s recent substantial appreciation.
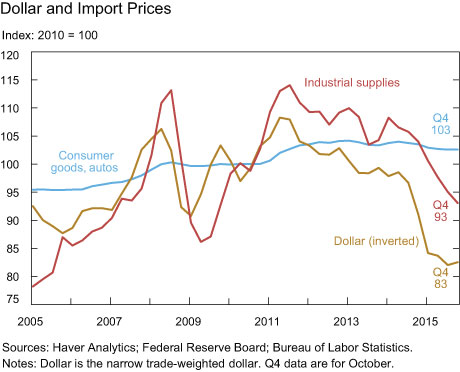
Our analysis suggests that the dollar affects U.S. consumer price inflation primarily through commodity prices rather than through prices of finished imported goods. Therefore, a key factor to consider in anticipating how consumer prices will be affected by a stronger dollar is the behavior of commodity prices. Namely, any period of disconnect between the dollar and commodity prices should alter a forecast of how the dollar will affect import prices and U.S. inflation. For example, the FRBNY trade model predicted that non-oil import prices would fall 5 percent between 2014:Q2 and 2015:Q2. Instead, the index fell only 2.5 percent. It wasn’t the behavior of import prices of auto and consumer goods that was the source of the forecast error. Instead, it was that commodity prices did not fall as much as we would have expected based on past co-movements with the dollar.
Disclaimer
The views expressed in this post are those of the authors and do not necessarily reflect the position of the Federal Reserve Bank of New York or the Federal Reserve System. Any errors or omissions are the responsibility of the authors.

Thomas Klitgaard is a vice president in the Federal Reserve Bank of New York’s Research and Statistics Group.

Patrick Russo is a senior research analyst in the Bank’s Research and Statistics Group.


 RSS Feed
 Follow Liberty Street Economics