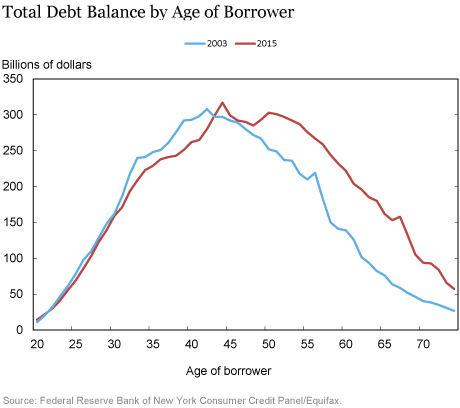
The U.S. population is aging and so are its debts. In this post, we use the New York Fed Consumer Credit Panel, which is based on Equifax credit data, to look at how debt is changing as baby boomers reach retirement age and millennials find their footing. We find that aggregate debt balances held by younger borrowers have declined modestly from 2003 to 2015, with a debt portfolio reallocation away from credit card, auto, and mortgage debt, toward student debt. Debt held by borrowers between the ages of 50 and 80, however, increased by roughly 60 percent over the same time period. This shifting of debt from younger to older borrowers is of obvious relevance to markets fueled by consumer credit. It is also relevant from a loan performance perspective as consumer debt payments are being made by older debtors than ever before.
The chart below depicts U.S. aggregate debt balances by the age of the borrower in 2003 and 2015. Balances are reported in 2015 dollars throughout this post, for ease of comparison.
Why has the mass of U.S. debt shifted so heavily to older borrowers? Two potential explanations are an aging population and an overall change in the amount of debt per borrower that Americans choose to hold at each individual age. The following chart depicts the change in aggregate debt held by individuals of each age from 2003 to 2015, as a share of their 2003 debt. The blue segment of each bar represents the change in aggregate debt at each age that would be predicted based on the change in Americans’ age distribution from 2003 to 2015 alone, if each age group held the same debt per borrower in 2015 that it held in 2003. The gold segment of each bar shows the change in debt at each age that is attributable to changes in the amount of debt per borrower of each age group.
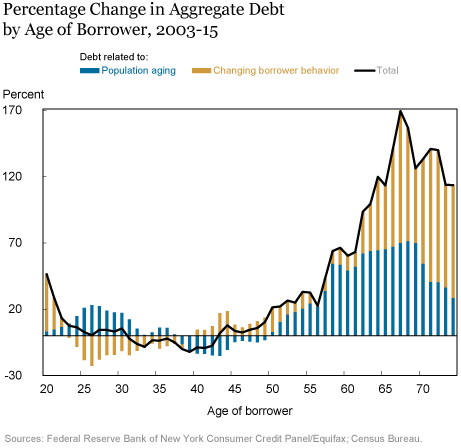
As the baby boom generation ages, the population of older individuals has increased substantially. And with the coming of age of the millennial generation, the population of younger adults has also increased. As the number of Americans both reaching older ages and entering adulthood climbs, we may expect higher aggregate debt balances in the hands of both older and younger borrowers. However, we find ample evidence of increased debt balances among older borrowers and no evidence of increased balances among the young.
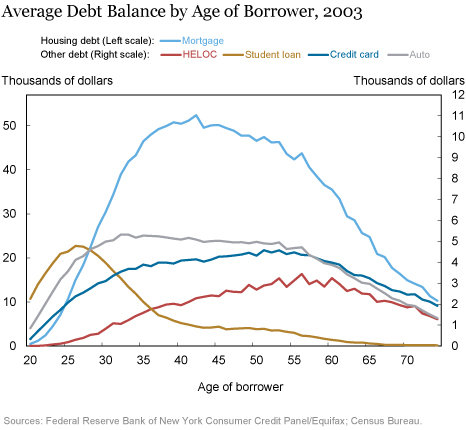
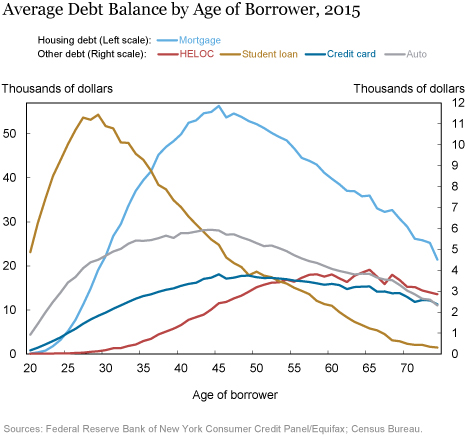
What types of borrowing play the largest role in the observed surge in debt at older ages? The following two charts show average debt per U.S resident by age in 2003 and in 2015. Each chart collects the age profiles of borrowers for five loan types—mortgages, auto loans, credit cards, student loans, and home equity lines of credit (HELOCs).
A comparison of the 2003 and 2015 charts shows, primarily, two things. First, at each age the average student loan balance per borrower more than doubles. Second, the age distribution of each debt type shifts decisively to the right. Younger borrowers hold lower per capita balances in every debt category save student loans, and older borrowers hold higher per capita balances in every debt category save credit card debt. Setting aside the influence of an aging population, it remains the case that in 2015, on average, younger borrowers held less nonstudent debt and older borrowers held substantially more debt of nearly all types, than comparably aged borrowers held in 2003.
Why do we see this shift of debt balances to older borrowers? One possibility is that the credit boom preceding the Great Recession built higher consumer debt levels. Afterward, underwriting standards tightened across the board in 2008-09, so that any new potential borrowers had little opportunity to take out new loans. An acceleration and then slowdown in lending across the board would lead loans, and their associated borrowers, to be older today on average than in 2003. Alternatively, the shift toward older borrowers could have resulted from new loan originations increasingly favoring older borrowers over younger borrowers, whether this arises from recent changes in borrower or lender behavior.
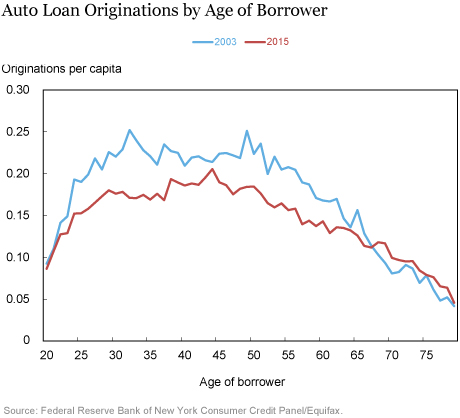
To weigh the relative contributions of these two factors to the graying of American debt, the two charts below depict the per capita age distribution of auto loan and mortgage originations in 2003 and 2015. In the case of auto loans, we see that the increase in the age of borrowers from 2003 to 2015 arises primarily from a shift in auto loan originations away from younger borrowers to older borrowers. Any decline in overall originations is comparatively modest.
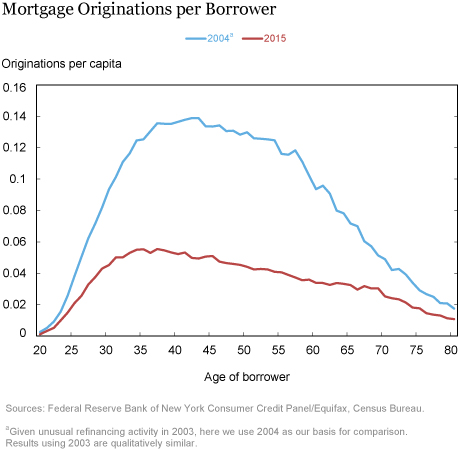
For mortgages, on the other hand, both factors appear to be at play. Mortgage originations have seen a pronounced decline at all ages from 20 to roughly 65. The drop in mortgage originations is steepest among middle-aged borrowers, with at least a 60 percent reduction in per capita originations at each age from 40 to 60. Declines for the oldest ages were comparatively modest. Hence we see decisive evidence of a boom and slowdown in mortgage originations at most ages, which by itself would generate an older class of mortgage holders by 2015. In addition, we observe a tilt of mortgage originations away from younger borrowers and toward older borrowers between 2003 and 2015.
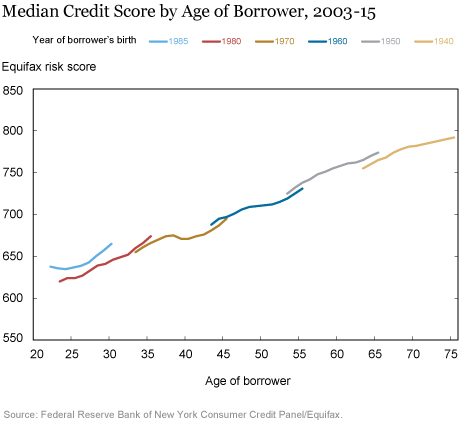
The tilting of new credit toward older ages may be an unsurprising consequence of credit tightening, when one considers the close relationship between credit risk score and age. The chart below depicts average Equifax risk score by age in the Consumer Credit Panel, calculated using data on six decennial birth cohorts from 2003 to 2015. Clearly higher risk score standards in underwriting affect younger borrowers differently than they do older borrowers. Further, among younger borrowers, the ballooning of student debt may have substantial spillover effects on their propensity and ability to take out new mortgages and auto loans, and it may postpone other types of consumption as it drives young borrowers home to live with their parents.
Finally, we turn to the question of what influence the graying of American debt may have on the resilience of banks’ consumer loan portfolios to adverse shocks and on prospects for economic growth. Regarding the resilience of consumer loans, most evidence suggests that the particular pattern of borrower aging that we have observed contributes positively to loan performance. The close relationship between credit score and age seen in the above chart reflects an average credit history that is considerably stronger among older borrowers. Various measures of repayment by age bear this out. The age gradients of both score and repayment quality are surprisingly stable over time in our data.
Further, older borrowers’ income streams are comparatively stable, and they have greater experience with credit. Survey of Consumer Finances data show that net worth levels for households with heads who are age 65 and older in 2013 are quite similar to their 2004-07 levels. This holds despite the evidence, seen in the second chart in this post, that consumers are holding substantially more per capita debt at age 65 and beyond. If history is any guide, then, we expect older borrowers to make more reliable payments. Indeed, our data show no clear trend toward higher delinquency at older ages as average balances at older ages have increased.
Hence the aging of the American borrower bodes well for the stability of outstanding consumer loans. At the same time, the likely combination of muted credit access and lower demand for credit that we observe among our younger borrowers may well have consequences for growth. The graying of American debt that we observe between 2003 and 2015, then, might be interpreted as a shift toward greater balance sheet stability, and away from credit-fueled consumption growth.
Disclaimer
The views expressed in this post are those of the authors and do not necessarily reflect the position of the Federal Reserve Bank of New York or the Federal Reserve System. Any errors or omissions are the responsibility of the authors.
 Meta Brown is a senior economist in the Federal Reserve Bank of New York’s Research and Statistics Group.
 Donghoon Lee is a research officer in the Bank’s Research and Statistics Group.

Joelle Scally is the administrator of the Center for Microeconomic Data in the Bank’s Research and Statistics Group.
Katherine Strair is a senior research analyst in the Bank’s Research and Statistics Group.

Wilbert van der Klaauw is a senior vice president in the Bank’s Research and Statistics Group.


 RSS Feed
 Follow Liberty Street Economics