What is the weather today? You don’t need to be a meteorologist to answer this question. Just take a look outside the window. Macroeconomists do not have this luxury. The first official estimate of GDP this quarter will not be published until the end of July. In fact, we don’t even know what GDP was last quarter yet! But while we wait for these crucial data, we float in a sea of information on all aspects of the economy: employment, production, sales, inventories, you name it. . . . Processing this information to figure out if it is rainy or sunny out there in the economy is the bread and butter of economists on trading desks, at central banks, and in the media. Thankfully, recent advances in computational and statistical methods have led to the development of automated real-time solutions to this challenging big data problem, with an approach commonly referred to as nowcasting. This post describes how we apply these techniques here at the New York Fed to produce the FRBNY Nowcast, and what we can learn from it. It also serves as an introduction to our Nowcasting Report, which we will update weekly on our website starting this Friday, April 15.
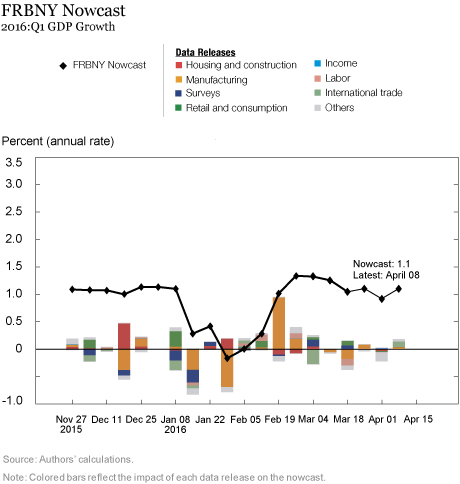
The chart below is the main visual tool that we created to track the evolution of the FRBNY Nowcast in real time, as macroeconomic news hits the tape. The black line with diamonds is our best estimate of GDP growth in the first quarter, based on information available at the dates represented on the x-axis. For instance, the last diamond says that the nowcast for GDP growth in the first quarter was 1.1 percent as of last Friday, based on information released until then. The first diamond in the series, instead, was our estimate of that same first-quarter GDP growth on November 27, 2015, when we started tracking the current quarter. The difference between two consecutive nowcasts, or the nowcast revision, is the weighted average effect of the news received during the week. The impact of the news on the nowcast is represented by the colorful bars, with different colors associated with news from particular sectors. For instance, news from international trade data contributed positively to the nowcast last week, increasing it by about 0.1 percentage point, as shown by the light green bar in the picture.
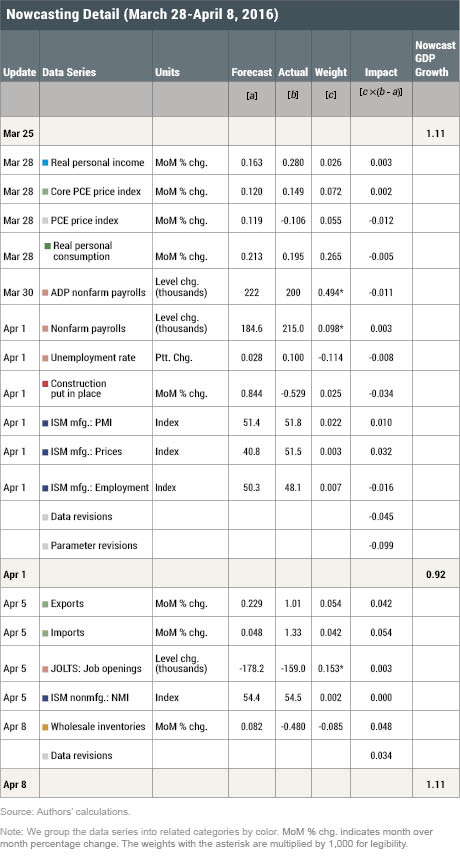
Though the chart above presents information at a weekly frequency, we update and monitor the FRBNY Nowcast on a daily basis, as soon as new data are released. The real-time updates for last week’s releases are reported in the table below. A more detailed version of this table, including a longer history of recent releases, is available in the Nowcasting Report. The table’s columns decompose the steps involved to parse the impact of each data release on the nowcast. These steps are performed by a statistical model that distills the intricate relationships among different data series into a small number of so-called factors, which summarize the underlying “state” of the economy. The model computes a forecast for each release, denoted by a. The difference between the actual release (b) and this forecast is the news (that is, b − a) contained in the release, the new piece of information revealed by the data. Finally, the news is combined with a weight (c), which captures the timeliness and quality of each piece of new information, to give us the impact (c × (b − a)) of the release on the nowcast. For example, the “All employees: Total nonfarm” payroll print for March of 215,000 jobs, which was released at 8:30 a.m. on April 1, represented positive news compared with the model’s expectation of 184,600 new jobs, yielding a surprise gain of 30,400 jobs. Given the weight (of 0.098/1,000) attributed to employment news by the model, this surprise translated into a positive impact on the nowcast of 0.003 percentage point.
But how reliable is the model that underlies the FRBNY Nowcast? For a complete answer to this important question, we refer you to the many academic studies that have been conducted on the subject. Overall, their findings suggest that nowcasting techniques produce results that are comparable to, and often more accurate than, those of the best human forecasters, with the added advantage of being automatic and free of judgment. This does not mean that nowcasting is always spot-on. The amount of noise in macroeconomic data is significant—even the official GDP release is revised twice before becoming “final.” As a result, the nowcast makes mistakes in any given quarter, like all economists’ forecasts do.
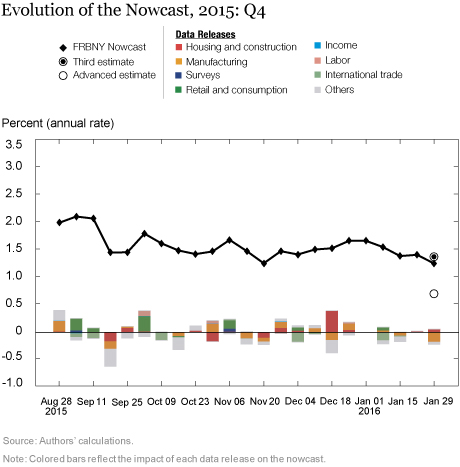
As an illustration, the chart below reports the evolution of the nowcast for 2015:Q4, a quarter for which we already have the third estimate of GDP. This estimate is represented as a full dot in the chart, along with the first, or preliminary, estimate (the empty dot).
By the time the first release became available, the nowcast predicted a growth rate for GDP of 1.2 percent, which is very close to the latest available number. Of course, this is only one example. However, the more comprehensive studies mentioned above demonstrate the usefulness of statistical nowcasts as a way of translating the real-time data flow into an estimate for current GDP. This reliability makes nowcasts a fundamental instrument in policymakers’ toolbox, especially in this era of data-dependent monetary policy.
Disclaimer
The views expressed in this post are those of the authors and do not necessarily reflect the position of the Federal Reserve Bank of New York or the Federal Reserve System. Any errors or omissions are the responsibility of the authors.
 Grant Aarons is a senior research analyst in the Federal Reserve Bank of New York’s Research and Statistics Group.
 Daniele Caratelli is a senior research analyst in the Bank’s Research and Statistics Group.
Matthew Cocci, a former research analyst in the Research and Statistics Group, is a Ph.D. student in economics at Princeton University.

Domenico Giannone is a research officer in the Research and Statistics Group.

Argia Sbordone is a vice president in the Research and Statistics Group.

Andrea Tambalotti is an assistant vice president in the Research and Statistics Group.


 RSS Feed
 Follow Liberty Street Economics
In reply to Dhaneesh: Thank you for your interest. We did not publish a Nowcasting Report on April 22 because it fell during a blackout period surrounding this month’s Federal Open Market Committee (FOMC) meeting. We will resume publication this week on our normal schedule, releasing the report on Friday at 11:15 a.m. You can keep track of FOMC blackout periods using this calendar maintained by the St. Louis Fed: https://www.stlouisfed.org/about-us/resources/blackout-periods. We continue to update the nowcast internally during the blackout periods and the analysis will be reported in the next available publication.
Will you be updating this weekly on Fridays as mentioned in the article above? If so, where can I find the Friday April 22 update? Thanks
In reply to Charles Self: We have performed extensive back-testing of the model, which we plan to share in the near future. In the meantime, we refer the reader to extensive academic research [https://biblio.repec.org/entry/cab.html] that, as discussed in the Q&A of the Nowcasting Report [https://www.newyorkfed.org/research/policy/nowcast.html], “have shown that the platform is able to approximate best practices in macroeconomic forecasts. The model produces forecasts that are as accurate as, and strongly correlated with, predictions based on best judgment.” In reply to Tauno Loertscher: We track the annualized quarterly (“q/q”) growth rate of GDP, not the 4 quarters (“y/y”) growth rate.
In reply to Andrew Stout: The FRBNY Staff Nowcast and the Atlanta Fed’s GDPNow are both based on statistical filtering techniques applied to a dynamic factor model. These techniques are very common in big data analytics since they effectively summarize the information contained in large datasets through a small number of common factors. The general framework for macroeconomic nowcasting has been developed in the academic literature over the past ten years, as discussed in the Q&A included in our Nowcasting Report. The FRBNY Staff Nowcast is a straightforward application of the most advanced techniques developed in this academic literature. GDPNow adapts these techniques to mimic the methods used by the BEA to estimate real GDP growth, as well explained by GDPNow’s own FAQs. Because GDPNow and the FRBNY Staff Nowcast are different models, they can generate different forecasts of real GDP growth. Our policy is not to comment on or interpret any differences between the forecasts of these two models.
Do you have real time and/or back tested data for your Nowcast model that you are willing to share?
I assume the 1.1% “annual rate” is the y/y growth rate? If so, is there a specific reason you are looking at the y/y growth rate and not the q/q saar growth rate? Do you provide the latter as well? Thank you!
What are the major conceptual differences between your Nowcast and the Atlanta Fed’s Nowcast (which sits 0.1% compared to your 1.1%)?