U.S. Treasury security settlement fails—whereby market participants are unable to make delivery of securities to complete transactions—spiked in March 2016 to their highest level since the financial crisis. As noted in this post, fails delay the settlement of transactions and can therefore lead to illiquidity, create operational risk, and increase counterparty credit risk. Fails in the Treasury market attract particular attention because of the market’s key role for global investors as a pricing benchmark, hedging instrument, and reserve asset. So what drove the March spike? In this post, we show that much of it reflected sequential fails of benchmark ten-year notes and thirty-year bonds, but that fails in seasoned issues—which have been trending upward for several years—were also elevated.
The Fails Spike
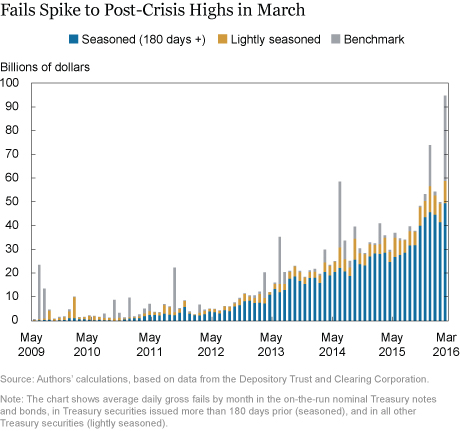
Settlement fails in U.S. Treasury securities rose to their highest level in more than seven years in March. Among the netting membership of the Depository Trust and Clearing Corporation (DTCC), gross fails (the sum of fails to deliver and fails to receive) aggregated across all Treasury issues averaged $95 billion per day over the month, as shown in the chart below. That said, fails remained well below the historic high of $504 billion per day observed in October 2008 at the peak of the financial crisis.

The spike in fails is primarily attributable to a jump in fails of benchmark (that is, “on-the-run”) securities but also to a continued rise in fails of seasoned securities, or securities issued more than 180 days prior. Both series reached post-crisis highs in March, with aggregate benchmark fails averaging $36 billion per day and aggregate seasoned fails averaging $50 billion per day. Fails in all other (or “lightly seasoned”) Treasury securities were below post-crisis highs in March, averaging $9 billion per day.
The Rise in Seasoned Fails
In a recent post, we explored fails of seasoned issues in detail, showing that they are widely dispersed over a large number of securities and that they tend to be resolved within a few days (updated versions of that post’s charts are available here ). An earlier post suggested that regulatory initiatives of recent years may have reduced institutions’ willingness to intermediate securities loans and repurchase agreements, which may help explain the rise in seasoned fails. However, the trend in seasoned fails seems to have started before recent regulatory initiatives were binding, suggesting that non-regulatory factors are also at play.
The Surge in Benchmark Fails
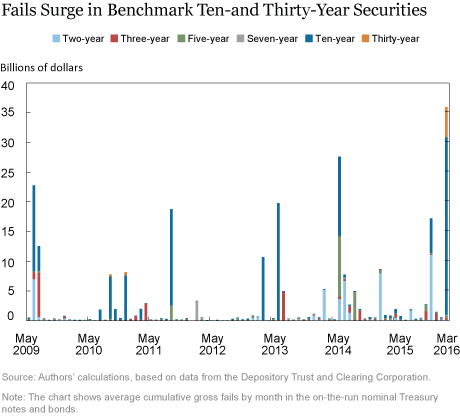
The next chart shows that the surge in fails of benchmark issues is entirely attributable to fails in the ten-year note and, to a lesser extent, the thirty-year bond. In fact, fails of the ten-year note are not uncommon and help explain many of the past spikes in benchmark fails. The June 2014 spike in fails—which marked the previous post-crisis peak in fails and which is described in this post—was driven by fails in the five- and ten-year notes, and, to a lesser extent, the two-year note.

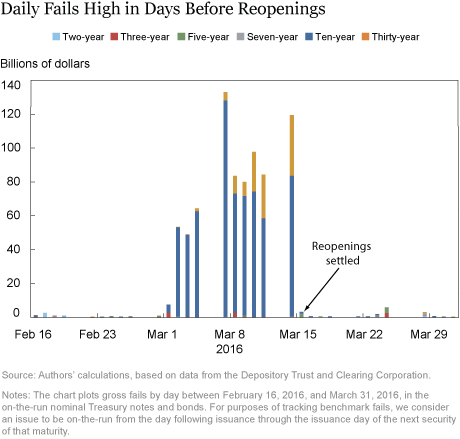
Interestingly, nearly all of the benchmark fails in March occurred before March 15, as shown in the chart below. The sequential pattern of fails in the days before March 15 is a common feature of benchmark fails because the underlying causes of fails (that is, high demand to borrow securities, low supply of lendable securities, or both) tend to be persistent. On March 15, additional amounts of the outstanding benchmark ten- and thirty-year securities were issued though scheduled “reopenings,” alleviating shortages of those two benchmark issues and quickly clearing the settlement fails in the issues.

Proximate Cause of Benchmark Fails
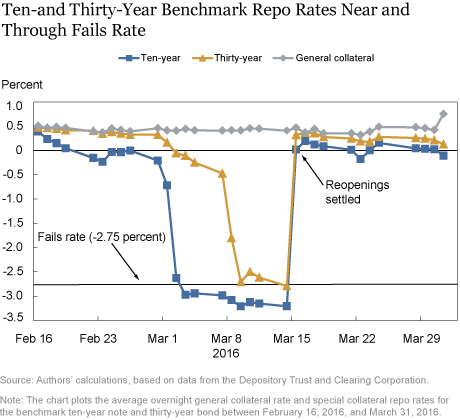
The proximate cause of the benchmark fails in the first half of March was a limited supply of the ten- and thirty-year securities relative to the demand to borrow these securities to cover short positions. This shortage was reflected in special repo rates for these securities (that is, security borrowing rates) trading close to, and occasionally through, the repo fails rate of -2.75 percent per annum, as shown in the next chart. In general, when specials rates approach the fails rate, market participants become roughly indifferent between borrowing securities to make delivery and failing to deliver securities; as a result, increases in fails occur, as explained in this article.

When fails materialize, the risk of a self-fulfilling dynamic arises whereby some large holders of benchmark issues become reluctant to lend if they fear that the securities will not be returned at the end of the loan. That is, aversion to the counterparty credit risk that would ensue from not having securities promptly returned may cause some owners to choose not to lend when specials rates approach the fails rate, despite the high compensation provided to securities lenders at such times. Such a pullback can increase the likelihood that settlement fails will persist as reductions in available supply exacerbate the market imbalance.
Insufficient incentive to borrow securities to avoid failing contributed to episodes of high and persistent settlement fails after September 11, 2001, in the summer of 2003, and during the financial crisis. Record fails during the crisis provided the impetus for the Treasury Market Practices Group to promote the introduction of a fails charge in May 2009, as explained here. While the charge did not eliminate settlement fails, fails have been lower since, with fails episodes being of lesser magnitude and duration.
Underlying Cause of Benchmark Fails
Demand to borrow benchmark securities results from market participants holding open short positions in these issues, and such demand is common when securities are on-the-run because these issues offer participants the best market liquidity, allowing large position adjustments with limited price impact relative to more seasoned Treasury securities. Short interest in benchmark issues can reflect a number of factors, including market-making activity to satisfy customer demand to own the securities, relative value trading, and hedging of general interest rate risk, among others. In this case, market participants reported that the majority of the short base resulted from relative value trading and dealer hedging related to ongoing foreign reserve selling. A range of relative value strategies were at play because the ten-year note was viewed as rich on an outright, curve, and breakeven basis—perhaps making this factor the primary driver of this dislocation.
Discussion
While the March benchmark fails were notable for being somewhat elevated compared with the recent past, it is not unusual for the benchmark ten-year note to become dislocated in the first month after its original issuance. The Treasury debt management practice of having scheduled reopenings of the ten-year note (and thirty-year bond) in the two months following initial issuance has proven effective at limiting the duration of fails episodes, and the practice once again proved effective in resolving the fails in March (as shown by the return of benchmark fails to normal levels on March 15). Nonetheless, given the secular rise in seasoned fails and the relative size of the March benchmark fails, this is an area we will continue to monitor and study closely.
Disclaimer
The views expressed in this post are those of the authors and do not necessarily reflect the position of the Federal Reserve Bank of New York or the Federal Reserve System. Any errors or omissions are the responsibility of the authors.
 Michael J. Fleming is a vice president in the Federal Reserve Bank of New York’s Research and Statistics Group.
 Frank M. Keane is an assistant vice president in the Bank’s Markets Group.


 RSS Feed
 Follow Liberty Street Economics
We appreciate the comments and questions on our post. In response to Anonymous, the Treasury Department has reopened issues on an ad hoc basis only very rarely, with the last unscheduled reopenings at the height of the 2007-09 financial crisis. After those reopenings, Treasury Acting Assistant Secretary for Financial Markets Karthik Ramanathan said, “In general, unscheduled reopenings are contrary to Treasury’s policy of transparency, regularity, and predictability. Treasury’s reluctance to conduct unscheduled reopenings is consistent with our long-standing policy, and unscheduled reopenings have been, and will remain, the exception.” (from: https://www.treasury.gov/press-center/press-releases/Pages/hp1237.aspx). In response to Cameron, we refer you to the Valukas report (https://jenner.com/lehman) for a thorough review of the Lehman bankruptcy. Your collateral question in particular seems to concern the market for general collateral repurchase agreements, whereas our article concerns delivery fails in the market for special collateral repurchase agreements and the outright (or cash) market. Our colleagues have written extensively on the general collateral repo market, including the collateral pledged in tri-party general collateral agreements (see, for example, https://www.newyorkfed.org/research/epr/2012/1210cope.html).
Beyond a small number of events for technical reasons, fails are at best an example of an improperly priced option or, at worst, raw market manipulation. Fining fails has been shown an effective mechanism for reducing them but obviously the penalty is not high enough.
See “Underlying Cause of Benchmark Fails”. In spite if the newish penalty charge for failing to deliver securities pledged in repos, I read this as saying that hedge funds and banks (especially those doing foreign exchange carry trades for speculative profits) are behind these massive and dangerous spikes in repo fails. Perhaps the penalty charges on speculative trades should be double or triple those of a commercial bank who fails in the ordinary course of bank-to-bank lending. Do I accurately recall that a $50 billion repo fail was the final event that brought Lehman down ? In this case, it was because Lehman didn’t have the high quality US Treasuries to make the trade acceptable. Question: Aside from US Treasuries, what is acceptable collateral ?
Great article painting a good picture reg fails in the repo market. Do you think Treasury would start using fails as an indicator to step in and re-open the 10 yr on the runs on a need basis(if the fails persist and continue to converge to the fails level) rather than wait till the scheduled auctions?