The New York Fed started releasing results from its Survey of Consumer Expectations (SCE) three years ago, in June 2013. The SCE is a monthly, nationally representative, internet-based survey of a rotating panel of about 1,300 household heads. Its goal, as described in a series of Liberty Street Economics posts, is to collect timely and high-quality information on consumer expectations about a broad range of topics, covering both macroeconomic variables and the households’ own situation. In this post, we look at what drives changes in consumer inflation expectations. Do people respond to changes in recent realized inflation, and to expected and realized changes in prices of salient individual commodities—like gasoline? Understanding what drives inflation expectations is important for the conduct of monetary policy, since it improves a central bank’s ability to assess its own credibility and to evaluate the impact of its policy decisions and communication strategy.
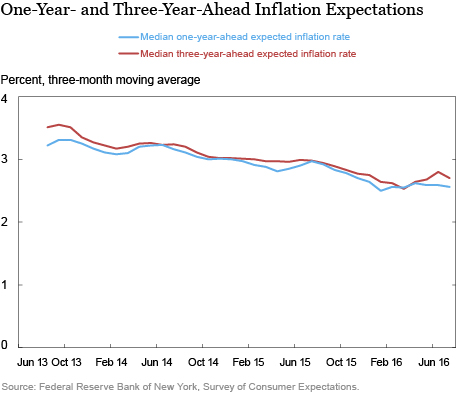
The SCE collects consumer inflation expectations over one-year and three-year (more precisely, a one-year two-year-forward) horizons. As discussed in this recent speech, we consider the latter to be well-suited to measure inflation expectations at the medium-term horizon that matters most for central bankers, since monetary policy is expected to exert its full effect within that time frame. The chart below shows the time series of median expected inflation at both horizons. We report the three-month moving average of both series to emphasize the trends rather than month-to-month movements. From the inception of the survey until January 2016, median expected inflation trended downward. Starting in January 2016, however, the trend reversed, with medium-term expected inflation increasing about 40 basis points through June. The latest July numbers suggest a pause in this reversal, but more data are needed to determine whether this is a temporary pause or a resumption of the previous downward trend.

To ensure that the recent upward movement did not simply reflect changes in the composition of survey respondents between January and June, we leveraged the rotating panel nature of our survey and looked at just the 495 respondents who participated in both surveys. The average change in medium-term expectations between January and June for this fixed subset of respondents was roughly the same (36 basis points). This upward movement was more pronounced for older and lower income respondents, as well as those with some college education.
What Drives Changes in Inflation Expectations?
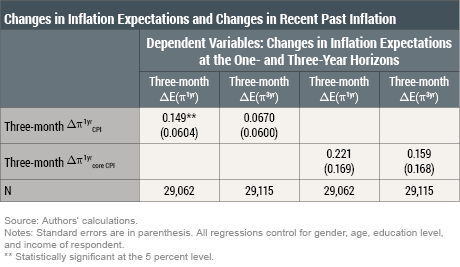
So, it is clear from the chart above that inflation expectations change over time, but what drives such changes? In particular, one may wonder whether people modify their inflation expectations as a result of recent observed changes in realized inflation. To address this question, we use SCE data collected over the June 2013 to June 2016 period to calculate three-month changes in each respondent’s inflation expectations (for example, between March and June) at the one- and three-year horizons (denoted in our regressions by

and

, respectively). We focus on three-month changes, rather than month-to-month changes, to capture larger and more meaningful movements in expectations. In the table below, we regress these measures on the three-month change over the same period in actual inflation (as measured by the percentage change in the consumer price index [CPI] over the previous twelve months and denoted as

), while controlling for respondents’ characteristics (such as education and age).

The results indicate that while our one-year-ahead expectations measure is significantly correlated with recent changes in realized total CPI inflation, medium-term inflation expectations are not. Neither expectations measure is significantly correlated with core CPI inflation (which excludes food and energy price inflation). This suggests that medium-term inflation expectations have remained well-anchored over this period, since they do not co-move with recent changes in realized inflation. Short-term expectations, on the other hand, do respond to changes in realized headline inflation (but not core inflation), perhaps reflecting some sensitivity of people to salient price changes.
Inflation Expectations and Expected Price Changes for Specific Items
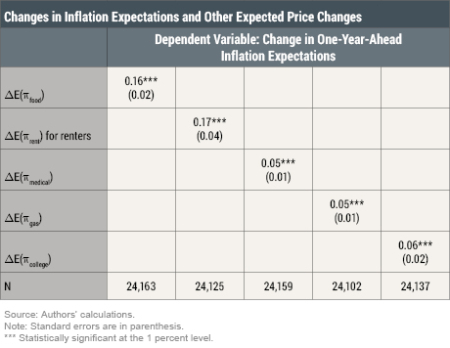
We now examine the extent to which inflation expectations are consistent with expected price changes for individual items that we collect in the SCE: food, gasoline, rent, medical care, and the cost of a college education. The table below reports separate regressions of the three-month change in overall year-ahead inflation expectations on three-month changes in year-ahead expectations of inflation for individual items. Overall inflation expectations are positively associated with price change expectations for each of those items: the coefficients for each item are in line with the expenditure shares of each item in the typical consumption basket from the Bureau of Labor Statistics’ Consumer Expenditure Survey (CEX). For instance, the estimated coefficient for the price of food is 0.16 whereas the average expenditure share of food in the CEX is 0.13. The coefficient on rent is 0.17 whereas the expenditure share of the shelter component of housing is 0.20. For gasoline, the estimated coefficient (0.05) is the same as the expenditure share of gasoline and motor oil. Results using our medium-term measure of overall inflation expectations as a dependent variable are very similar, with a slightly larger association with expected price changes for medical care and college education, and a slightly weaker association with price change expectations for gasoline. These regressions suggest that our measures of overall inflation expectations are not unduly influenced by any specific expenditure item, but rather appropriately reflect the composition of the average expenditure basket in the United States.

The Gas Pump Effect
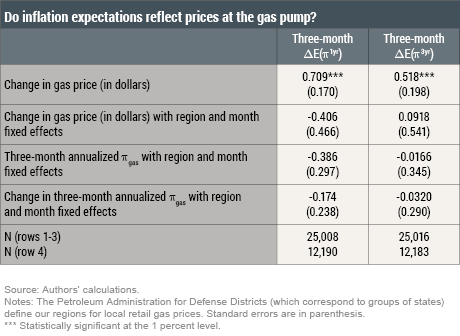
Some commentators have conjectured that consumers’ inflation expectations mostly reflect the changes in gas prices they observe at the pump. We investigate this conjecture in the table below, exploiting time and regional variation in gas prices. The dependent variables in the two columns are the same as in the first table—namely the three-month changes in each respondent’s inflation expectations at the one- and three-year horizons (denoted by

and

, respectively).
The first row shows that three-month changes in gas prices exhibit a statistically significant, and large, correlation with changes in inflation expectations at both horizons: a $1 increase in gas prices is associated with a 71 basis point increase in inflation expectations at the one-year-ahead horizon and a 52 basis point increase at the three-year-ahead horizon. While the large coefficient estimates seem consistent with some commentary, the correlation is likely to be overstated because of omitted economic conditions that affect both gas prices and views about future inflation. In fact, looking within a given region or given month period (using region and time fixed effects in the second row) makes the correlation negative and statistically insignificant. The rest of the table confirms this finding: the third row uses the annualized gas price inflation rate (denoted as

), whereas the last row looks at the three-month change in annualized gas price inflation (denoted as

). Neither specification yields a statistically significant association with changes in overall inflation expectations.

Consumers’ inflation expectations, especially at the medium-term horizon, gradually declined between July 2015 and January 2016, but have since risen—albeit with a pause in the most recent July reading. We find changes in overall inflation expectations to be consistent with changes in expected price changes for individual expenditure items, reflecting their relative importance in total household spending. Looking in more detail at the drivers of changes in inflation expectations, our analysis indicates that changes in medium-term inflation expectations—those that matter most for central bankers in the conduct of monetary policy—are not significantly related to recent changes in actual inflation or in gasoline prices at the pump. This suggests that medium-term inflation expectations have remained largely well-anchored over the sample period under consideration.
Disclaimer
The views expressed in this post are those of the authors and do not necessarily reflect the position of the Federal Reserve Bank of New York or the Federal Reserve System. Any errors or omissions are the responsibility of the authors.

Olivier Armantier is an assistant vice president in the Federal Reserve Bank of New York’s Research and Statistics Group.

Giorgio Topa is a vice president in the Bank’s Research and Statistics Group.

Wilbert van der Klaauw is a senior vice president in the Bank’s Research and Statistics Group.

Basit Zafar is a research officer in the Bank’s Research and Statistics Group.
How to cite this blog post:
Olivier Armantier, Giorgio Topa, Wilbert van der Klaauw, and Basit Zafar, “How Do People Revise Their Inflation Expectations?,” Federal Reserve Bank of New York Liberty Street Economics (blog), August 22, 2016, http://libertystreeteconomics.newyorkfed.org/2016/08/how-do-people-revise-their-inflation-expectations.html.


 RSS Feed
 Follow Liberty Street Economics