Editor’s note: The chart sources cited in this post have been corrected. (September 9, 12:55 p.m.)
In the first post in this series, we characterized the rapid transformation of the higher education market over the 2000-2015 period, a transformation that was led by explosive growth of the for-profit sector of higher education. In the second post, we found that most of this growth was driven by nontraditional students entering these institutions. Given this growth and the marked change in student composition, it is important to understand what impact these patterns might have on student loan originations, student loan volume, and the borrower pool in the various sectors of higher education. While a causal analysis is beyond the scope of this post, we instead examine descriptive patterns in these critical postsecondary outcomes. Was the growth in for-profit enrollment associated with a higher incidence of student loans? Were for-profit students, the main contributors of this growth, more or less likely to take student loans, and were they more or less likely to originate larger student loans? How about community-college borrowers, especially since community college enrollment increased noticeably over the period? This post focuses on these questions.
Federal Student Loan Originations
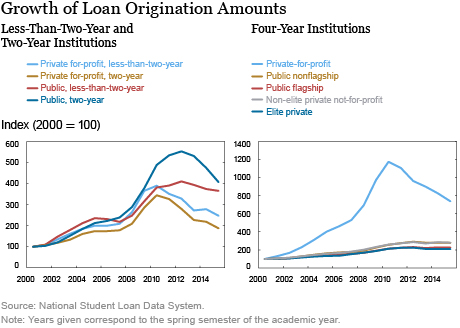
The analysis in this post pertains to federal student loan originations; private student loan originations, which currently constitute less than 10 percent of the student loan market, are not included here. Total federal loan origination amounts began to rise steadily starting in 2000, but they show a markedly higher growth immediately following the recession in all types of institutions, as seen in the chart below. There are two primary reasons for this growth. First, the immediate post-recession period was characterized by a large increase in student borrowers stemming from the huge growth in enrollment, as many young workers who lost jobs during the downturn chose to go back to college. (As we will show later in this post, this growth in the number of borrowers was most prominent in the public community college sector and the four-year for-profit sector, which partly explains the patterns in the charts.) Second, the average per-student dollar amount of loans originated grew dramatically following the recession (largely because of federal loan limit increases). However, as the recovery set in, these new student borrowers left college or graduated without being replaced, leading to a steep decline in loan originations.

Loan origination amounts grew strongly in the two-year and less-than-two-year public colleges, as shown in the left panel, above. This increase was in large part the result of aggressive growth in the number of borrowers at these colleges (as seen in charts later in this post). It is worth noting that the elimination of the Federal Family Education Loan (FFEL) program in 2010 to some extent led to the widening of the gap between the less-than-two-year and two-year public schools. FFEL loans were much more important in the less-than-two-year public schools. Yet the switchover or pass through from FFEL to direct loans was much less perfect in the less-than-two-year sector, implying that the direct loan program did not increase enough in the less-than-two-year sector to make up for the elimination of the older program.
Although loan originations also showed increases in four-year institutions in the 2000s, and especially immediately following the recession, the increases in the four-year for-profit sector dwarfed those of all other four-year institution types. Loan origination amounts at for-profit schools increased by more than 1,000 percent between 2000 and 2011, before dropping off steeply through 2015. Notwithstanding this subsequent decrease, the total loan origination amount in 2015 was more than seven times that of the 2000 levels in for-profit schools. This pattern mimics the corresponding enrollment pattern (see our first post in this series), suggesting that the growth was largely owing to the explosive increase in enrollment in this sector. However, per recipient amounts also increased, as seen in the last set of charts in this post.
While 94 percent of students at two-year schools in 2015 studied at public institutions, students at for-profit schools accounted for nearly one-third of total loan origination amounts. This overrepresentation of for-profit students among loan-holders is also seen in the less-than-two-year and four-year sectors. Across all institutions, 9 percent of students are enrolled at for-profit schools, yet for-profit students account for 17 percent of all loan dollars originated. In all sectors, the share of for-profit loan amounts increased immediately after the recession and declined later, consistent with the enrollment trends. In the two-year sector, the share of for-profits in loan originations has fallen in the post-recession period largely because of the increase in the number of borrowers in public institutions. In the four-year sector, the share of loan originations by for-profit students increased in the first decade of the century. The peak in four-year for-profit originations immediately following the recession was largely the outcome of an increase in enrollment and, as enrollment leveled off at for-profit schools following the recession, the share of loan originations going to these students has declined.
Direct Subsidized Loans (DSLs)
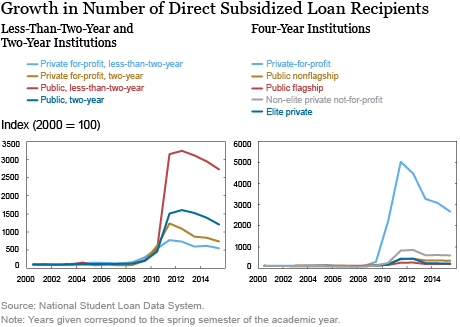
The chart below shows the growth in the number of direct subsidized loan (DSL) recipients. Direct subsidized loans are based on income eligibility and are available to relatively low-income students. Their terms are more favorable than those of unsubsidized loans, so students typically move on to unsubsidized loans after maxing out on DSLs or if they are not eligible for DSLs. With increases in enrollment in the immediate post-recession period, the number of borrowers in each type of institution rose explosively, as seen in the chart below. Consistent with earlier New York Fed findings on all student loan borrowers using the New York Fed Consumer Credit Panel/Equifax, the number of DSL borrowers peaked in 2011 (equating to the 2010-11 award year). While enrollment increased 42 percent between 2000 and 2011 across all sectors, the number of student borrowers receiving DSLs increased 567 percent, suggesting that many more students were borrowing to invest in a college education. One reason for this change may be that the composition of the student population changed when nontraditional students entered in larger numbers following the most recent recession, as discussed in our previous blog post. The general spike in 2011 can largely be explained by the discontinuation of the FFEL program and corresponding movement of student borrowers to federal direct loans.
The largest increase in much of the post-recession period is seen in the public less-than-two-year institutions, largely because the initial start in 2000 was from a very low base. Between 2000 and 2011, the number of DSL borrowers at public, less-than-two-year institutions grew more than 3,000 percent and at public two-year schools by 1,400 percent. In terms of sheer numbers, however, these institutions added 11,000 and 1.3 million borrowers, respectively, over the period. In the four-year sector, the largest increase is seen in the for-profits, where the number of students receiving DSLs in 2011 was more than 50 times that in 2000 (growing from just over 30,000 to 1.53 million). Declines are seen in all sectors after 2011, when enrollment tapered off as labor market conditions improved.

In each sector, the share of students receiving DSLs who attend for-profit institutions is much larger than the share of total enrollees who attend these schools. As shown in the chart above, this outsized representation of borrowers at for-profit institutions jumped dramatically following the most recent recession, but it has since declined. At less-than-two-year institutions, the share of borrowers at public schools increased from 1 percent in 2010 to 4 percent in 2015, and among two-year institutions, the share of borrowers at public schools increased from 61 percent in 2010 to 76 percent in 2015.
While the share of DSL borrowers at for-profit schools declined between 2000 and 2015 in the two-year and less-than-two-year markets (despite the aforementioned jump following the recession), the market share of for-profit schools among DSL borrowers in the four-year sector was significantly and persistently changed beginning in 2010. As of 2015, it had increased to 18 percent, six times its 2000 share of 3 percent. Indeed, the percentage of DSL borrowers attending any type of four-year institution other than for-profit or non-elite not-for-profit has decreased dramatically over the past seven years. Unsurprisingly, these trends in the direct subsidized loan market closely follow enrollment trends over a similar time horizon, as we saw in the first blog post in this series. The above analysis reveals that for-profit schools are driving the increase in borrowers at four-year institutions. In sharp contrast to the four-year market, growth among student borrowers in the two-year and less-than-two-year market is being largely driven by community colleges.
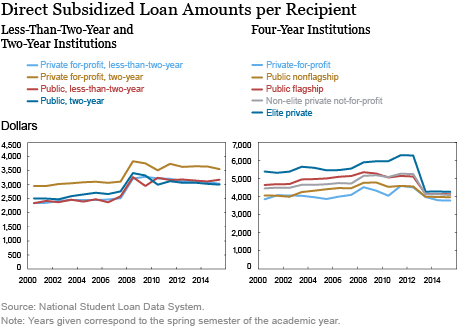
The chart below plots the DSL amount per recipient over time in the different types of postsecondary institutions. Subsidized loans are the cheapest and most accessible form of federal loans available to low-income students. The chart tracks many of the changes that have taken place in the student loan regulatory sphere since 2000. The Higher Education Reconciliation Act (HERA) of 2005 was signed into law in February 2006 and took effect in July 2007. It increased the Stafford loan limits for freshmen, sophomores, and graduate students. The effect of the Stafford cap increase is clearly illustrated by the marked upward shift in the amount per borrower in the 2007-08 award year in each type of two-year and less-than-two-year institution. To a lesser extent, this pattern also is visible in the four-year sector. Between 2007 and 2008, the amount received per recipient at less-than-two-year and two-year schools increased by 23 percent, from $2,760 to $3,412. Of note is that in all years, recipients at for-profit, two-year schools received the highest amount in the two-year and less-than-two-year sector, and in 2015 the average recipient at one of these schools received 18 percent more than students at any of the other institutions. In contrast, per borrower amounts were the largest in the elite private institutions, largely the result of higher tuition prices. In 2013, we see a steep decline in the size of the direct subsidized loan per recipient at four-year institutions. This stems from the Budget Act of 2011, which eliminated subsidized Stafford loans for graduate and professional students. As expected, this has much less of an effect on two-year and less-than-two-year institutions.

Conclusion
Over the past sixteen years, the higher education loan landscape transformed dramatically. All types of institutions have seen the number of borrowers increase markedly, and borrowers are taking on much more debt than they were in 2000. Over the past few years, this growth in the number of borrowers at two-year and less-than-two-year schools was driven in large part by new community-college borrowers, and it was predominantly driven by new for-profit borrowers in the four-year sector. In our next and final post, we’ll investigate how this new borrowing and influx of new borrowers (who were typically different from the traditional borrowers) are affecting student outcomes. We’ll examine default behavior and graduation rates across the different sectors and look to see where the financial health of the market might be headed in coming years.
Disclaimer
The views expressed in this post are those of the authors and do not necessarily reflect the position of the Federal Reserve Bank of New York or the Federal Reserve System. Any errors or omissions are the responsibility of the authors.
 Rajashri Chakrabarti is a senior economist in the Federal Reserve Bank of New York’s Research and Statistics Group.
Michael Lovenheim is an associate professor at Cornell University and a faculty research fellow at the National Bureau of Economic Research.
Kevin Morris is a senior research analyst in the Federal Reserve Bank of New York’s Research and Statistics Group.
How to cite this blog post:
Rajashri Chakrabarti, Michael Lovenheim, and Kevin Morris, “The Changing Role of Community-College and For-Profit-College Borrowers in the Student Loan Market,” Federal Reserve Bank of New York Liberty Street Economics (blog), September 8, 2016, http://libertystreeteconomics.newyorkfed.org/2016/09/the-changing-role-of-the-community-college-and-for-profit-college-borrowers-in-the-student-loan-mark.html.


 RSS Feed
 Follow Liberty Street Economics