Editor’s note: The labels for “Elite private” and “Non-elite private, not-for-profit” institutions in the charts have been corrected; they were initially transposed. We regret the error. (September 12, 12:45 p.m.)
This is the final post in a four-part series examining the evolution of enrollment, student loans, graduation and default in the higher education market over the course of the past fifteen years. In the first post, we found a marked increase in enrollment of 35 percent between 2000 and 2015, led mostly by the for-profit sector—which increased enrollment by 177 percent. The second post showed that these new enrollees were quite different from the traditional enrollees. Yesterday’s post demonstrated an unprecedented increase in loan origination amounts during this period—nearly tripling between 2000 and 2015. This surge was driven most prominently by a massive increase in the number of borrowers in the public community college sector and the private for-profit college sector. Given the large increase in the borrower pool and loan originations, it is paramount to understand the consequences of these changes for the student loan default rate. This post aims to do just that. We focus on three-year cohort default rates reported by the United States Department of Education. The three-year cohort default rate is defined as the percentage of a school’s borrowers who enter repayment during a particular federal fiscal year—running from October 1 to September 30—and default prior to the end of the second following fiscal year. Most federal loans enter default when payments are more than 270 days past due.

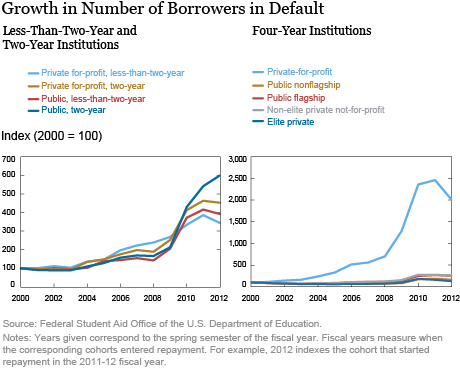
Among less-than-two and two-year institutions, the number of borrowers in default (NBD) has grown most dramatically for students at public, two-year schools. The growth in the number of borrowers in default at two-year, for-profit institutions follows close behind. As we saw in our post on the student loan market, there was a huge increase in the number of borrowers as well as a modest increase in the amount borrowed by students at these schools following the recession. The chart above shows that these newer borrowers have had a difficult time repaying their loans since leaving school and therefore many of them are entering default. Between 2000 and 2008, total loan originations at less-than-two-year and two-year institutions grew by 152 percent; the majority of students enrolling in these years would have entered repayment between 2000 and 2012. Tellingly, there was a more than five-fold increase in NBD between 2000 and 2012. Thus, the growth in NBD far outpaced the growth in loan originations in this sector.
Among four-year institutions, the growth of NBD at for-profit institutions dwarfed the growth in other sectors. This relates to the marked increase in the number of borrowers and loan originations in the four-year, for-profit sector during this period that we saw in the third post in this series. Between 2000 and 2007, total loan originations at four-year, for-profit schools grew by 430 percent. Between 2000 and 2012, when many of these borrowers would have entered repayment, NBD at these schools rose by more than 1,900 percent. As might be expected, NBD declined in most sectors as the economic recovery gained momentum in later years.
It is worth noting that the share of borrowers in default who attended for-profit institutions greatly exceeded the share of students enrolled at these schools. Among borrowers in the 2012 repayment cohort who defaulted on their loans, an astounding 39 percent attended for-profit schools. In contrast, in 2011—the year in which for-profit schools had their highest share of enrollees—only 11.5 percent of higher-education students were enrolled at for-profit schools. This suggests that recent cohorts of students at for-profit institutions have emerged from school less likely to repay the loans they used to finance their educations.
Moreover, the share of borrowers from four-year institutions entering default who attended for-profit schools has increased dramatically over the past twelve years. Beginning in 2009, and for every year thereafter, for-profit institutions accounted for more borrowers in default at four-year institutions than any other sector despite never accounting for more than 11 percent of enrolled students. Among two-year institutions, however, there is a marked increase in the share of borrowers who default after attending public schools, beginning in 2010 and continuing through 2012. This mirrors the trend we saw in our previous post showing large increases in the number of borrowers and loan originations in this sector.

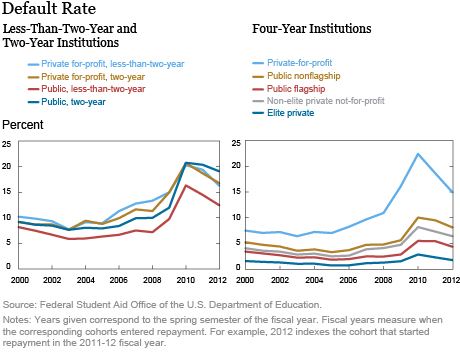
Turning to actual default rates, we see that the default rates for students at for-profit schools have generally been much higher than the default rates at any other type of institution, particularly at four-year institutions. From 2004 onward, the default rate at for-profit institutions is roughly two to three times the rate at any other type of four-year institution. As may be expected, the default rates at all institution types rose the most during and immediately following the recession. Between 2000 and 2010, the default rate at two-year and less-than-two-year institutions rose from 9 percent to 21 percent, and at four-year institutions from 5 percent to 12 percent. Although for-profit schools underperformed public schools as measured by default rates in all sectors for most of the repayment cohorts above, this was no longer the case for the 2012 repayment cohort in the two-year sector.
The huge growth of borrowers and loan originations at public two-year schools over this period have translated into a default rate that exceeds that of any other type of institution in the two- and less-than-two-year market. Among the 2012 cohort, public two-year schools have a default rate 2.3 percentage points higher than for-profit two-year schools—which had default rates of 19.1 percent and 16.8 percent, respectively. While our findings are based on three-year cohort default rates based on U.S. Department of Education data, it is worth noting that three-year default rates dramatically understate lifetime defaults.
Finally, we turn to rates of graduation within 150 percent of scheduled time—in other words, three years for less-than-two-year and two-year institutions, and six years for four-year institutions. Interestingly, graduation rates appear to be fairly immune to the factors correlated with changes—such as the recession, changes in funding laws, enrollment growth—that we have examined during this series. As huge numbers of students flowed into the different types of institutions, these marginal students do not appear to have been any more or less prone to graduate on time. Similarly, the deterioration of the economic climate in 2009 does not appear to have encouraged students to take longer or to complete their studies more quickly.
Among the less-than-two-year and two-year institutions, public two-year institutions have by far the lowest graduation rate. These schools recorded a graduation rate of 22 percent, compared with 63 percent for all other students in this category, and a graduation rate of 59 percent at for-profit, two-year schools. Despite a general upward trend in the graduation rate of four-year institutions, the for-profit institutions saw a marked decline in their graduation rate beginning in 2007. As of 2015, only 29 percent of students at for-profit, four-year schools graduated within 150 percent of scheduled time, compared with 58 percent of students at all other institution types. Of particular interest is the fact that such high graduation rates are coupled with such poor loan repayment performance among the for-profit, two- and less-than-two year schools. The fact that so many students are unable to repay their loans even after graduating is surprising, given that there likely is some economic return to obtaining a degree or certificate from these institutions.
The health of the student loan sector has deteriorated quite steeply from 2000 to 2015. While this is mostly concentrated in for-profit, four-year schools, the decline is much more widespread in the two- and less-than-two-year market and essentially spans all types of institutions in this market. The default rate and number of borrowers in default at all types of two- and less-than-two-year institutions increased markedly over the period of study, as they did at the private and for-profit, four-year institutions. In the two- and less than two-year market, this deterioration was particularly prominent at the public two-year institutions, but for-profit institutions followed close behind. The trends in the student debt market we observed and the default rate patterns we have described paint a sobering picture of trends in higher education loans. If these outcomes do not improve substantially over the near future as the economy continues to recover, these may serve as a drag on the financial well-being of the nation.
Disclaimer
The views expressed in this post are those of the authors and do not necessarily reflect the position of the Federal Reserve Bank of New York or the Federal Reserve System. Any errors or omissions are the responsibility of the author.
 Rajashri Chakrabarti is a senior economist in the Federal Reserve Bank of New York’s Research and Statistics Group.
Michael Lovenheim is an associate professor at Cornell University and a faculty research fellow at the National Bureau of Economic Research.
Kevin Morris is a senior research analyst in the Federal Reserve Bank of New York’s Research and Statistics Group.
How to cite this blog post:
Rajashri Chakrabarti, Michael Lovenheim, and Kevin Morris, “Who Falters at Student Loan Payback Time?” Federal Reserve Bank of New York Liberty Street Economics (blog), September 9, 2016, http://libertystreeteconomics.newyorkfed.org/2016/09/who-falters-at-student-loan-payback-time.html.


 RSS Feed
 Follow Liberty Street Economics