Editor’s note: When this post was first published, the chart on loan originations contained an incorrect label; the chart and linked data file have been corrected. (December 1, 12:32 p.m.)
The latest Quarterly Report on Household Debt and Credit from the New York Fed’s Center for Microeconomic Data showed a small increase in overall debt in the third quarter of 2016, bolstered by gains in non-housing debt. Mortgage balances continue to grow at a sluggish pace since the recession while auto loan balances are growing steadily. The rise in auto loans has been fueled by high levels of originations across the spectrum of creditworthiness, including subprime loans, which are disproportionately originated by auto finance companies. Disaggregating delinquency rates by credit score reveals signs of distress for loans issued to subprime borrowers—those with a credit score under 620. In this post we take a deeper dive into the observed growth in auto loan originations and delinquencies. This analysis and our Quarterly Report are based on the New York Fed’s Consumer Credit Panel, a data set drawn from Equifax credit reports.
Originations by Credit Score
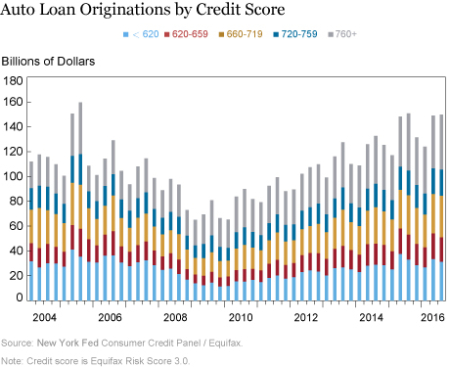
Originations of auto loans have continued at a brisk pace over the past few years, with 2016 shaping up to be the strongest of any year in our data, which begin in 1999. The chart below shows total auto loan originations broken out by credit score. The dollar volume of originations has been high for all groups of borrowers this year, with the quarterly levels of originations only just shy of the highs reached in 2005. The overall composition of both originations and outstanding balances has been stable.

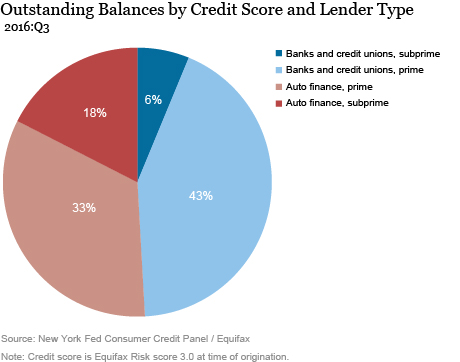
As we noted in an earlier blog post, one feature of our data set is that it enables us to infer whether auto loans were made by a bank or credit union, or by an auto finance company. The latter are typically made through a car manufacturer or dealer using Equifax’s lender classification. Although it remains true that banks and credit unions comprise about half of the overall outstanding balance of newly originated loans, the vast majority of subprime loans are originated by auto finance companies. The chart below disaggregates the $1.135 trillion of outstanding auto loans by credit score and lender type, and we see that 75 percent of the outstanding subprime loans were originated by finance companies.

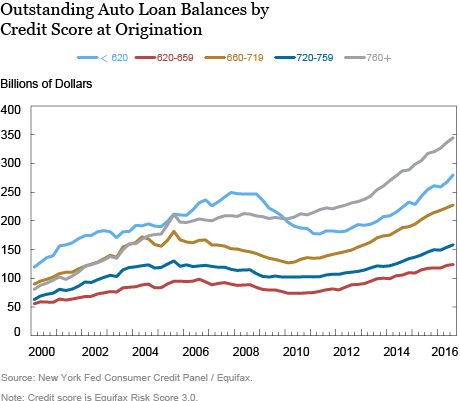
In the chart below, auto loan balances broken out by credit score reveal that balances associated with the most creditworthy borrowers—those with a score above 760 (in gray below)—have steadily increased, even through the Great Recession. Meanwhile, the balances of the subprime borrowers (in light blue below), contracted sharply during the recession and then began growing in 2011, surpassing their pre-recession peak in 2015.

Delinquency Rates
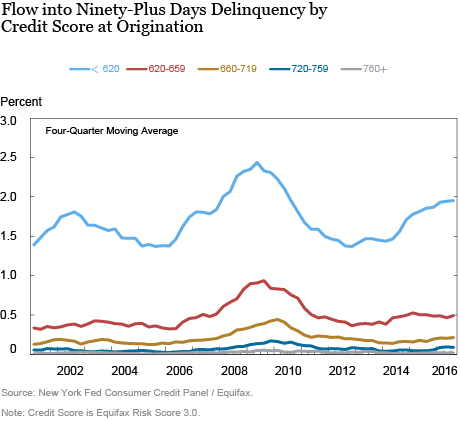
Auto loan delinquency data, reported in our Quarterly Report, show that the overall ninety-plus day delinquency rate for auto loans increased only slightly in 2016 through the end of September to 3.6 percent. But the relatively stable delinquency rate masks diverging performance trends across the two types of lenders. Specifically, a worsening performance among auto loans issued by auto finance companies is masked by improvements in the delinquency rates of auto loans issued by banks and credit unions. The ninety-plus day delinquency rate for auto finance company loans worsened by a full percentage point over the past four quarters, while delinquency rates for bank and credit union auto loans have improved slightly. An even sharper divergence appears in the new flow into delinquency for loans broken out by the borrower’s credit score at origination, shown in the chart below. The worsening in the delinquency rate of subprime auto loans is pronounced, with a notable increase during the past few years.

It’s worth noting that the majority of auto loans are still performing well—it’s the subprime loans that heavily influence the delinquency rates. Consequently, auto finance companies that specialize in subprime lending, as well as some banks with higher subprime exposure are likely to have experienced declining performance in their auto loan portfolios.
Conclusion
The data suggest some notable deterioration in the performance of subprime auto loans. This translates into a large number of households, with roughly six million individuals at least ninety days late on their auto loan payments. Even though the balances of subprime loans are somewhat smaller on average, the increased level of distress associated with subprime loan delinquencies is of significant concern, and likely to have ongoing consequences for affected households.
Disclaimer
The views expressed in this post are those of the authors and do not necessarily reflect the position of the Federal Reserve Bank of New York or the Federal Reserve System. Any errors or omissions are the responsibility of the authors.

Andrew F. Haughwout is a vice president in the New York Fed’s Research and Statistics Group.

Donghoon Lee is a research officer in the Bank’s Research and Statistics Group.

Joelle Scally is the administrator of the Center for Microeconomic Data in the Bank’s Research and Statistics Group.

Wilbert van der Klaauw is a senior vice president in the Bank’s Research and Statistics Group.
How to cite this blog post:
Andrew F. Haughwout, Donghoon Lee, Joelle Scally, and Wilbert van der Klauuw, “Subprime Auto Debt Grows Despite Rising Delinquencies,” Federal Reserve Bank of New York Liberty Street Economics (blog), November 30, 2016, http://libertystreeteconomics.newyorkfed.org/2016/11/just-released-subprime-auto-debt-grows-despite-rising-delinquencies.html.


 RSS Feed
 Follow Liberty Street Economics
Thanks for your question. The numerator in the last figure is the sum of balances that transitioned during the quarter to 90 or more days delinquent (including any repossessions) from current or early delinquency; the denominator is the sum of balances that were current or in early delinquency in the previous quarter.
How are the numbers for the graph in figure 4 calculated? What are the numerator and denominator?