Editor’s note: When this post was first published, the linked file with historical rates and volumes for the three Treasury repo rates had some minor errors. The data and related charts have been corrected. These changes did not alter the authors’ conclusions. (January 30, 2018, 4:00 p.m.)
Editor’s note: In the data file originally released with this post, some repo volume figures were misaligned with their dates; the problem has been corrected. (December 19, 2016, 11:15 a.m.)
In its recent “Statement Regarding the Publication of Overnight Treasury GC Repo Rates,” the Federal Reserve Bank of New York, in cooperation with the U.S. Treasury Department’s Office of Financial Research, announced the potential publication of three overnight Treasury general collateral (GC) repurchase (repo) benchmark rates. Each of the proposed rates is designed to capture a particular segment of repo market activity. All three rates, as currently envisioned, would initially be based on transaction-level overnight GC repo trades occurring on tri-party repo platforms. The first rate would only include transactions in the tri-party repo market, excluding both General Collateral Finance Repo Service, or GCF Repo®, transactions and Federal Reserve transactions. (GCF Repo is a registered service mark of the Fixed Income Clearing Corporation.) Henceforth in this post, this segment will be referred to as tri-party ex-GCF/Fed. The second rate would build on the first by including GCF Repo trading activity while still excluding Federal Reserve transactions. Finally, the third rate would include tri-party ex-GCF/Fed transactions, GCF Repo transactions, and Federal Reserve transactions. The repo benchmark rates would be calculated as volume-weighted medians, as is currently the case for the production of the effective federal funds rate (EFFR) and the overnight bank funding rate (OBFR), and would be accompanied by summary statistics. The three proposed rate compositions result from staff analysis on the various market segments and characteristic trading behavior, though the New York Fed expects to work with the Board of Governors of the Federal Reserve System to seek public comment on the composition and calculation methodology for these rates before adopting a final publication plan.
Goals of a GC Repo Benchmark
The principal driver behind the potential publication of overnight Treasury GC repo benchmark rates is to enhance market transparency and efficiency by improving the quality and breadth of repo market information available to the public. Currently, little rate information is available on the repo market. Among the information that does exist is the Bank of New York Mellon (BNYM) Treasury Tri-Party Repo Index, or “Treasury TRIP,” which reflects the average rate on all overnight Treasury-collateralized repo transactions cleared on BNYM’s platform, including the Fed’s overnight reverse repurchase (RRP) trades. In addition, the Depository Trust and Clearing Corporation (DTCC) publishes aggregated daily rate and volume data for the GCF Repo market in its own Treasury index.
The currently proposed repo benchmark rates differ from both the BNYM and DTCC indexes in several important ways. First, two of the three new proposed rates would exclude Fed transactions, thereby providing focused insight into market-determined collateralized funding rates. Second, consistent with best practices for financial benchmarks, the New York Fed plans to exclude trades that are conducted between affiliated entities in order to focus on arm’s-length transactions. Third, the proposed benchmark rates would have the flexibility to incorporate new sources of data were they to become available or as market dynamics change. Finally, the publication of additional summary statistics would provide incremental information about the distribution of rates and volumes in the repo market. The increased transparency provided by these rates would support the New York Fed’s primary objective of improving publicly available information on the repo market, and may support ongoing work by the Alternative Reference Rates Committee (ARRC).
Market Overview
The design of the three proposed benchmark rates is in large part driven by the structure and segmentation of the Treasury GC repo market. Consequently, it is worth reviewing some of the market’s salient features.
In the United States, the repo market is primarily subdivided on the basis of settlement platform. In the tri-party repo segment, transactions are negotiated between the cash lender and the collateral provider, while a third-party clearing bank acts as an intermediary by managing clearing and settlement of the trades. For bilateral repo transactions, however, the two institutions on either side of the repo contract and their respective custodian banks manage all aspects of trade settlement. The benchmark rates that the New York Fed proposes publishing are anticipated to rely only, at the outset, on transactions in the tri-party market, since robust data on the bilateral repo market are currently unavailable.
Within the tri-party market, there are three distinct sub-segments: tri-party ex-GCF/Fed, GCF Repo, and tri-party activity with the Federal Reserve. The segments are differentiated by the type of activity and the market participants.
The tri-party ex-GCF/Fed market predominantly consists of cash lenders, such as money market funds and other institutional asset managers that are seeking safe, collateralized investments. Securities dealers are the primary borrowers, entering into repo transactions to finance outright positions and the positions of their customers.
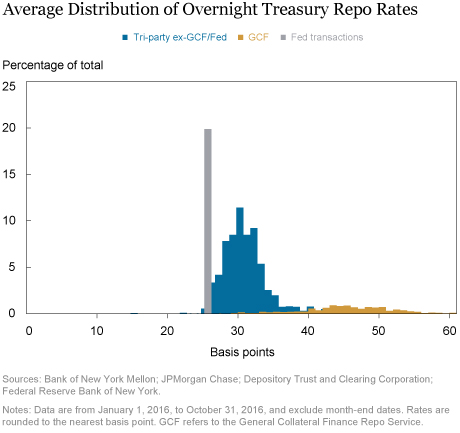
The second segment, the GCF Repo market, is an anonymously matched, centrally cleared interdealer market that settles on the tri-party platform. A typical transaction occurs between two types of dealers: dealers with established financing arrangements with other institutional cash investors lending to dealers that have more limited access to such funding arrangements. This cash intermediation leads to generally higher rates in the GCF Repo market compared with the broader tri-party market owing to the costs faced by the lending banks as they expand their balance sheets. This result is illustrated by the distribution of transactions in the chart below, in which GCF Repo transactions are to the right of tri-party ex-GCF/Fed transactions. Note that a handful of non-dealer institutional investors also have access to this market and may use it to obtain higher returns for their cash investments than they could otherwise earn in the tri-party ex-GCF/Fed market.
Finally, there is also a subset of tri-party activity for which the Federal Reserve is the counterparty facing market participants. This activity is part of the Fed’s open market operations used to influence other money market rates. While the current suite of policy tools includes the Fed’s overnight RRP facility, in the future the Fed could employ other repo-based facilities to implement monetary policy.

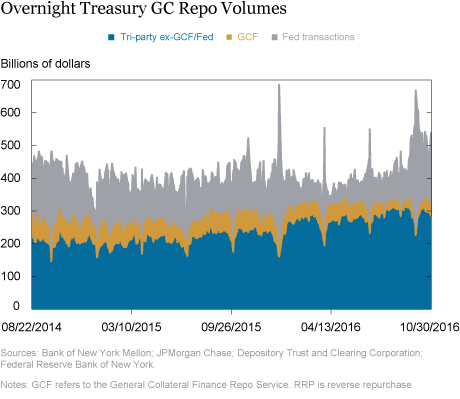
The chart below shows the relative sizes of the three tri-party market segments. Tri-party ex-GCF/Fed is the largest segment, representing roughly two-thirds of the total market, on average, so far in 2016. The GCF Repo segment is the smallest, representing roughly 10 percent of volume on average, while current Fed operations represent slightly more than 20 percent. Although there is some day-to-day variation in the sizes of the three market segments, these shares have been relatively stable over the past two years. However, one recurring shift in activity away from these steady averages occurs on financial reporting dates (month-end), when financial institutions reduce their borrowing activity and cash investors are left to reallocate into Fed repo facilities.

Three New Benchmarks
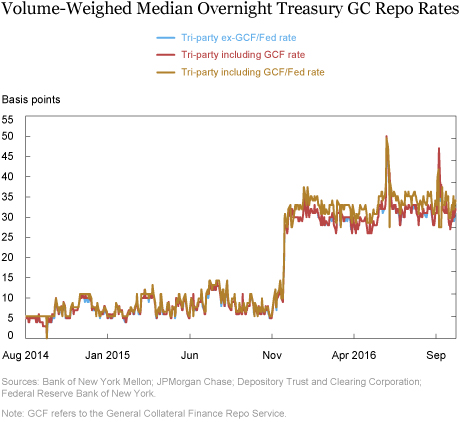
The chart below shows the behavior between August 2014 and October 2016 of the three proposed GC repo benchmark rates.

During the sample period, the three rates tracked each other closely, with each rate showing exactly the same value on 60 percent of the days. On those days where the rates differed, the rate including GCF Repo was slightly higher than the tri-party ex-GCF/Fed rate, reflecting the higher rates paid by cash borrowers in the GCF Repo market segment. In contrast, the tri-party including GCF Repo/Fed rate has been slightly lower than the tri-party including GCF Repo rate on financial statement dates, given that more activity flows into the overnight RRP on those dates.
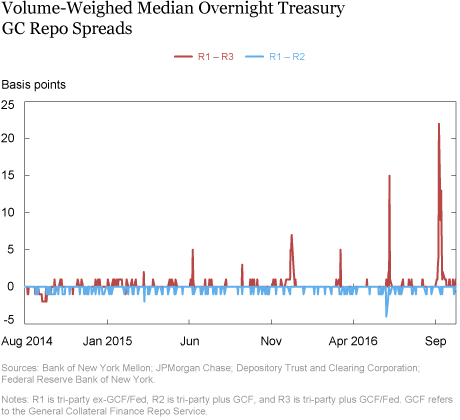
The chart below provides a closer look at these differences in the rates. Outside of quarter-ends, the tri-party ex-GCF/Fed rate is commonly one basis point lower than the tri-party including GCF Repo rate, and one basis point higher than the tri-party including GCF Repo and Fed transactions rate. There are more notable spreads between the tri-party ex-GCF/Fed rate and the tri-party including GCF Repo/Fed rate on quarter-end dates. The periodic shift in activity associated with dealers’ balance sheet constraints on quarter-ends results in Fed transactions—conducted at a lower rate than most market-determined rates—representing a larger proportion of activity in the tri-party including GCF Repo/Fed rate than on other dates. Therefore, as shown in the chart below, these dates usually see a discrete increase in the spread between the rates that include Fed transactions and those that exclude them. Note that the data do not include the time period prior to when the overnight RRP was being tested or was in production.

For those interested in further analyzing the data, both the total volume of activity and the value-weighted median rate for each proposed GC benchmark are available.
Calculation Methodology
As noted in its Statement, the New York Fed proposes calculating all three repo benchmark rates as volume-weighted medians. The volume-weighted median calculation has several advantages compared with other options: The median is more robust to erroneous data, consistent with the findings of comparable analysis for the EFFR and OBFR, and the median is the measure that most frequently reflects a transacted rate in all tested environments. To further explore the issue, a future post will discuss and illustrate the properties of various central tendency measures.
Disclaimer
The views expressed in this post are those of the authors and do not necessarily reflect the position of the Federal Reserve Bank of New York or the Federal Reserve System. Any errors or omissions are the responsibility of the authors.

Alexandra Altman is an associate in the Federal Reserve Bank of New York’s Markets Group.

Kathryn Bayeux is a senior analyst in the Markets Group.

Marco Cipriani is an officer in the Research and Statistics Group.

Adam Copeland is an officer in the Research and Statistics Group.
 Scott Sherman is an assistant vice president in the Market’s Group.
 Brett Solimine is a senior analyst in the Markets Group.
How to cite this blog post:
Alexandra Altman, Kathryn Bayeux, Marco Cipriani, Adam Copeland, Scott Sherman, and Brett Solimine, “Investigating the Proposed Overnight Treasury GC Repo Benchmark Rates,” Federal Reserve Bank of New York Liberty Street Economics (blog), December 19, 2016, http://libertystreeteconomics.newyorkfed.org/2016/12/investigating-the-proposed-overnight-treasury-gc-repo-benchmark-rates.html.


 RSS Feed
 Follow Liberty Street Economics
Thank you, Alex. The short answer is that we use a median measure rather than a mean. The volume-weighted median calculation used for the rates represents the rate at the 50th percentile of the volume distribution and so tends to reflect the rates of the largest segment of the market, the tri-party ex-GCF/Fed segment. The exceptions are quarter-end dates when the volume of Fed transactions increases notably, which results in a lower volume-weighted median rate. For more information on the volume-weighted median calculation, please see this “Technical Note Concerning the Methodology for Calculating the Effective Federal Funds Rate” posted on the New York Fed’s public website at https://www.newyorkfed.org/medialibrary/media/markets/EFFR-technical-note-070815.pdf.
Thanks for the post. I had a question regarding the chart of Volume-Weighted Median Overnight rates. I would have expected the rate that includes Fed RRP to track lower than the others; I see on the chart that it has spiked downward for quarter end, but it tracked the other rates for 60% of days. It appears that the volume of Fed transactions typically is around a quarter to a third of all daily volume, why do you think these transactions at 25 bps do not have more downward pressure on the index on days outside of quarter end?