While consumer confidence as measured by various surveys has increased sharply since the national election, the New York Fed’s Survey of Consumer Expectations (SCE) has shown little notable change in expectations. In this post, we show that the difference may partly reflect systematic compositional changes whereby respondents who answer a survey after the election differ in important ways from those answering the survey before the election—something which the SCE largely avoids. We also show that the flat average aggregate outlook in the SCE masks substantial regional/partisan heterogeneity in shifts in expectations.
The Outlook in Aggregate
We focus on responses to this question from the SCE:
“Looking ahead, do you think you (and any family living with you) will be financially better or worse off 12 months from now than you are these days?”
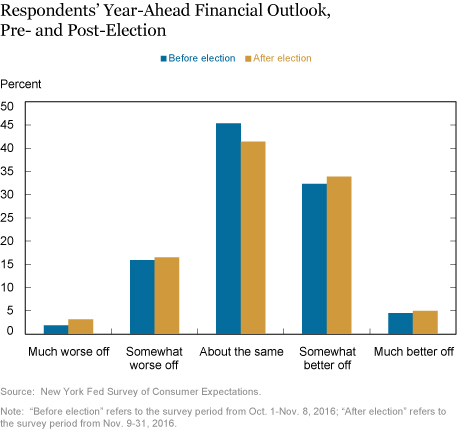
The SCE’s rotating panel of household heads lets us measure changes in expectations for the same person between surveys. As we discuss later in more detail, this is an important advantage over other surveys since we don’t have to worry about confounding changes in the composition of respondents over time. The chart below shows the distribution of responses for the same set of 829 household heads just before the election (Oct. 1-Nov. 8, 2016) and just after it (Nov. 9-31, 2016). The distributions appear very similar and, in fact, are not statistically different. For example, the 36.6 percent of respondents who expected to be somewhat or much better off financially just before the election is similar to the proportion after, 38.9 percent.
Heterogeneity in Outlook and Politics
Perhaps the flat expectations in aggregate is not so surprising; the election outcome was probably positive news for some and negative for others, and those shifts in expectations may have cancelled each other out. In other words, the impact on expectations probably depends on whom one supported for president.
While the SCE doesn’t ask about respondents’ political affiliations, it does include their home zip codes, which we use as a proxy for political affiliation. For example, a respondent residing in Tarrant County (one county in Fort Worth, Texas), which voted for the GOP presidential candidate in 2012 and 2016, is more likely to lean Republican than a respondent in New York County (one county in New York City), which voted Democratic in both elections. With this reasoning in mind, we allocate respondents into four groups based on their county’s voting in the 2012 and 2016 presidential elections: “GOP counties,” which voted for the GOP presidential candidate in both elections; “Dem counties,” which voted for the Democratic candidate in both; “Flipped GOP counties,” which voted Democratic in 2012 but GOP in 2016, and “Flipped Dem counties,” which voted vice versa. Of our 829 respondents, 267 live in GOP counties, 438 in Dem counties, 100 in Flipped GOP counties, and 24 in Flipped Dem counties.
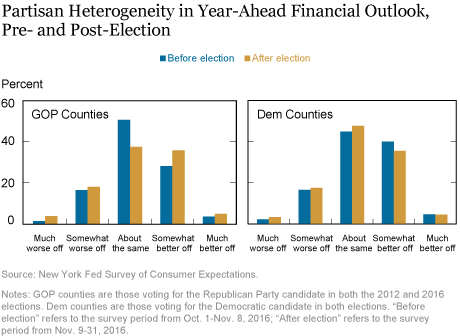
We anticipate that expectations for respondents in GOP counties would tend to rise/improve after the election and those in Dem counties would tend to fall. We expect a similar, but less pronounced effect for flipped counties (that is, a rise in expectations in Flipped GOP counties, and a decline in Flipped Dem counties). In fact, the chart below shows that for respondents in GOP counties (left panel), the proportion expecting to be financially (somewhat or much) better off in a year rose from 31.6 percent before the election to 40.6 percent after the election. The responses for Dem counties (right panel) show a diminished outlook: the proportion expecting to be financially (somewhat or much) better off in a year dropped from 41.2 percent to 36.9 percent after the election. These results confirm that the aggregate figure above was concealing heterogeneity based on political preferences.
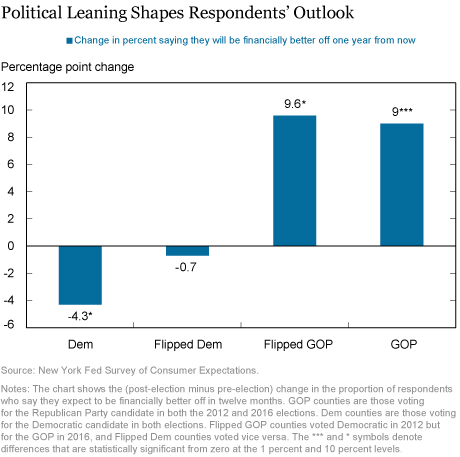
The chart below presents the change in expectations (post-election minus pre-election) for the share of respondents who expect to be financially (somewhat or much) better off in a year for each of the four groups. In line with our intuition, we see that the share of such respondents increases in areas that voted for the GOP candidate and decreases in areas that voted for Democratic candidate in 2016.
Heterogeneity in Market Outlook and Politics
We see a similar pattern in Americans’ expectations about stock market performance in the chart below.
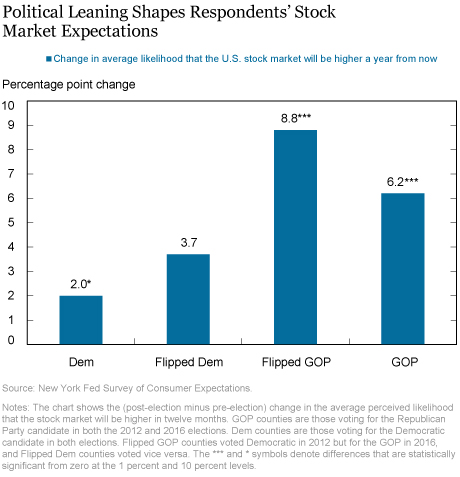
The SCE asks respondents “What do you think is the percent chance that 12 months from now, on average, stock prices in the U.S. stock market will be higher than they are now?” The results show a large positive change (post-election minus pre-election) for respondents in counties that voted for the GOP candidate in 2016. For example, the average response for individuals in Flipped GOP counties rose by a sizable 8.8 points, on a baseline average perceived likelihood of 35.9 percent. Though we also see an increase in expectations in counties that voted for the Democratic candidate, the increase is noticeably larger for areas that voted for the GOP candidate.
Sampling Volatility and Compositional Bias
While we’ve shown that the aggregate SCE expectations statistics conceal considerable regional/political variation in shifts in these expectations, we haven’t explained why SCE expectations have been flat on average while consumer confidence in other surveys has increased. We suspect that difference is partly due to the more stable sample composition in the SCE; unlike these other surveys, the SCE includes a set of repeat respondents with only a small fraction of new respondents added each month. By design, this feature reduces sampling volatility resulting from compositional changes from month to month. In the present case, the concern is that, in surveys using a changing sample, new respondents who were willing to be surveyed after the election could differ in important ways from those willing to be surveyed before the election. If so, then rising expectations detected in these other surveys may partly reflect these compositional changes. And while one can control for observable differences between new and repeat respondents, selection bias along unobservable dimensions would remain a concern.
The chart below suggests that selection bias might help explain why other surveys show rising expectations compared with the SCE. It plots the distribution of responses to the SCE question about the financial outlook in the November survey for the 829 repeat respondents studied above along with the responses of the 134 new respondents surveyed for the first time during the post-election period in November. The new respondents appear much more optimistic than the repeat respondents. It is worth noting that we do not see such a pattern in prior months when comparing repeat and new respondents. This is consistent with more optimistic people (that is, people for whom the election outcome was positive news) being more likely to choose to take the survey when invited for the first time after the election.
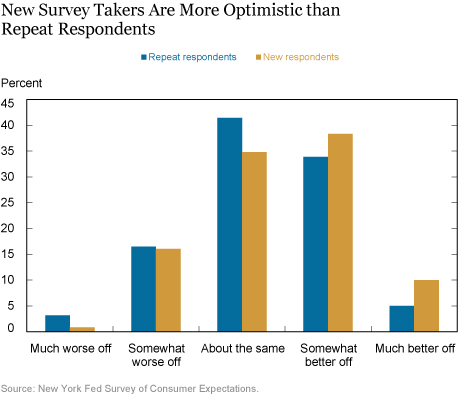
Since these respondents constitute only a small proportion (13.9 percent) of the monthly sample, they don’t drastically affect the aggregate statistics in the SCE. By contrast, for surveys where the sample composition varies from month to month, the rise in the average outlook may partly reflect compositional changes where more optimistic people are taking the survey rather than the average person becoming more optimistic.
Disclaimer
The views expressed in this post are those of the authors and do not necessarily reflect the position of the Federal Reserve Bank of New York or the Federal Reserve System. Any errors or omissions are the responsibility of the authors.
 John J. Conlon is a senior research analyst in the New York Fed’s Research and Statistics Group.

Basit Zafar is a research officer in the Bank’s Research and Statistics Group.
How to cite this blog post:
John J. Conlon and Basit Zafar, “Measuring Americans’ Expectations Following the 2016 Election,” Federal Reserve Bank of New York Liberty Street Economics (blog), January 23, 2017, http://libertystreeteconomics.newyorkfed.org/2017/01/measuring-americans-expectations-following-the-2016-election.html.



 RSS Feed
 Follow Liberty Street Economics
Very nice piece guys!