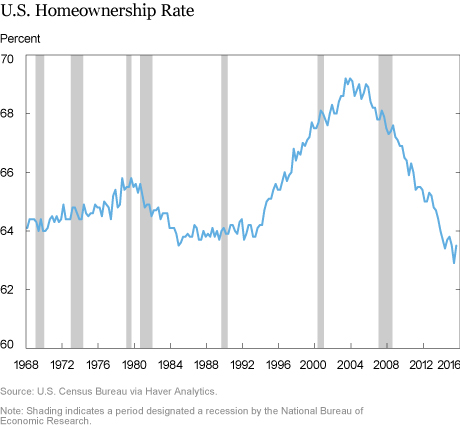
The homeownership rate peaked at 69 percent in late 2004. By the summer of 2016, it had dropped below 63 percent—exactly where it was when the government started reporting these data back in 1965. The housing bust played a central role in this decline. We capture this effect through what we call the homeownership gap—the difference between the official homeownership rate and the “effective” rate where only homeowners with positive equity in their house are counted. The effective rate takes into account that a borrower does not in an economic sense own the house if the mortgage debt is greater than the house’s value. In this post, we show that between 2005 and 2012, the effective rate fell well below, and put downward pressure on, the official rate. We also demonstrate that the increase in house prices and the exit of millions of homeowners through foreclosure has largely eliminated the gap between the official and effective homeownership rates.
The U.S. Census Bureau has produced national estimates of the homeownership rate since 1965. This “official” measure of homeownership is the percentage of all occupied housing units that are occupied by their owners. (We’ll discuss the details more tomorrow.) As the chart below shows, over the first thirty years, the official homeownership rate varied between 63 percent and 66 percent. The data also show a notable divergence in this pattern after 1995, when the rate rose steadily and ultimately exceeded 69 percent by 2004 before beginning an equally steep decline.

Conceptually, this official homeownership measure is more legal than economic—it answers the question “what share of occupied units are occupied by the person whose name is on the deed?” As we discussed in our prior post, “The Evolution of Home Equity Ownership,” some families own the home they live in free and clear. For those households, it’s obvious that the person whose name is on the deed owns the property. Other homeowners, though, have debt for which their home serves as collateral. For this latter group, an economist might ask a somewhat different question about ownership, “Does the household have equity in this property?” When a household has positive equity, with the value of the property exceeding the value of the debt it secures, it has economic incentives to take appropriate steps to maintain and increase the value of the home, since any such increases accrue to the homeowner. But, for a homeowner with negative equity, additions to house value that would result from borrower maintenance efforts actually accrue to the lender, at least until (and if) house values rise enough to restore the occupant to positive equity. As a result, a negative equity owner may act more like a renter.
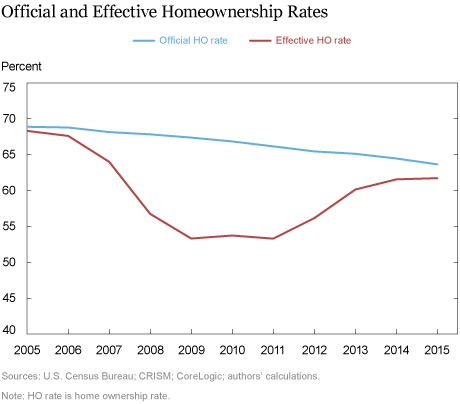
We can thus consider, in addition to the official rate, an effective rate, which recalculates the homeownership rate treating negative equity owners instead as renters. To do so, we are able to take advantage of the recent estimates of negative equity provided in Guttman-Kenney, Fuster, and Haughwout (2016). These calculations combine (weighted) CRISM loan-level mortgage and junior lien data with CoreLogic house price indexes to estimate equity (and combined loan-to-value ratios) for each property. Since today’s post is on homeownership, we restrict our attention to owner-occupied properties.
The next chart shows the relationship between the official and effective homeownership rates from 2005 to 2015. The difference between the official and effective rates is what we refer to as the “homeownership gap.”

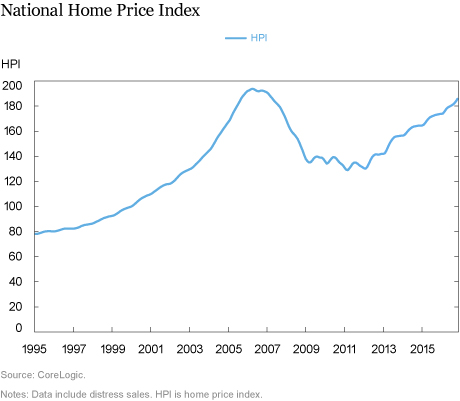
As the data for 2005 suggest, in normal times the homeownership gap is close to zero, since very few households are in negative equity. However, the rapid decline in prices that commenced in 2006 produced a large homeownership gap that persisted for several years. More recently, the homeownership gap has narrowed, through a combination of a falling official rate and a rising effective rate.
In an earlier paper on this subject, which appeared in 2010, we estimated a smaller homeownership gap using less complete data on house-price movements. We speculated then that, unless house prices rose, the gap would close with the official rate falling toward the effective rate. Our argument was that many of the borrowers who were in negative equity were at risk of foreclosure, and would ultimately exit ownership through a short sale or mortgage default. Given the severe damage to credit scores that a foreclosure or serious delinquency implies, these borrowers would find it difficult to become owners again in the near term, reducing the official homeownership rate for the foreseeable future.
Indeed, foreclosures have exerted significant downward pressure on the measured homeownership rate since 2006. A recent blog trying to calculate how big this effect was indicates that roughly 4.8 to 5.8 million owner-occupants lost their homes to foreclosure, with about 88 percent of that group still not returning to homeownership in 2015, either by their own choice or because of damage to their credit records. This suggests that foreclosures emanating from the housing crisis reduced the number of 2015 homeowners by 4.2 to 5.1 million. This effect directly reduces the homeownership gap by bringing the official rate down, closer to the effective rate.
Inspection of the chart below, however, indicates that a second powerful force also worked to narrow the homeownership gap. The long decline in house prices leveled off in 2010 and finally began to reverse in 2012—a development that constitutes the major factor in closing the homeownership gap by bringing the effective line up toward the official. In 2009, when the gap was at its largest, we estimate that over 10.5 million households were underwater on their housing debt and thus were official, but not effective, homeowners. By 2015, fewer than 1.5 million households were underwater, meaning that about nine million owner-occupant households have left negative equity since 2009. At most, about 5 million of these exited through foreclosure, and the rest were lifted out of negative equity by rising house prices. So while foreclosures accounted for much of the decline in official homeownership, they were responsible for only roughly half of the reduction in the homeownership gap, with rising prices doing the rest.

The remaining vestiges of the housing crisis are fading. In over half the states, prices and homeowner’s equity have recovered to their pre-crisis levels. The removal of foreclosure notations from (potential) borrowers’ credit reports, along with the closing of the homeownership gap, has now set the stage for homeownership to revert to its fundamental drivers: demographics and the state of the economy. In tomorrow’s post, we take a look at how these fundamentals are evolving and what they portend for the future of household formation and homeownership.
Disclaimer
The views expressed in this post are those of the authors and do not necessarily reflect the position of the Federal Reserve Bank of New York or the Federal Reserve System. Any errors or omissions are the responsibility of the authors.

Andrew F. Haughwout is a vice president in the New York Fed’s Research and Statistics Group.

Richard Peach is a senior vice president in the Bank’s Research and Statistics Group.

Joseph Tracy is an executive vice president and senior advisor to the president of the Federal Reserve Bank of New York.
How to cite this blog post:
Andrew F. Haughwout, Richard Peach, and Joseph Tracy, “The Homeownership Gap Is Finally Closing,” Federal Reserve Bank of New York Liberty Street Economics (blog), February 16, 2017, http://libertystreeteconomics.newyorkfed.org/2017/02/the-homeownership-gap-is-finally-closing.html.


 RSS Feed
 Follow Liberty Street Economics