This post is the second in a two-part series on student loan default behavior. In the first post, we studied how educational characteristics (school type and selectivity, graduation, and major) and family background relate to the incidence of student loan default. In this post, we investigate whether default behavior has varied across cohorts of borrowers as the labor market evolved over time. Specifically, does the ability of student loan holders to repay their loans vary with the state of the labor market? Does the type of education these students received make any difference to this relationship?
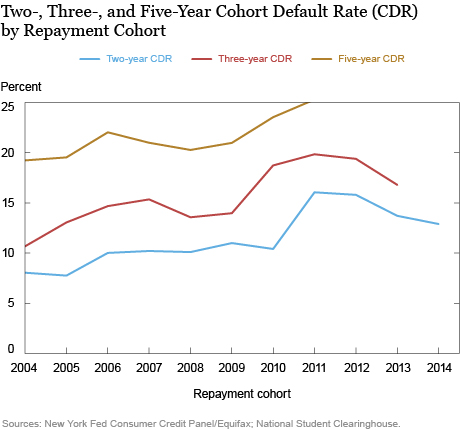
To examine these questions, we group students into repayment cohorts, based on when they would have been expected to begin student loan repayment. Because student loan repayment typically begins six months after a student leaves school (assuming the student does not enter deferment or forbearance), a student’s repayment cohort year corresponds to the fiscal year that follows her graduation year (and presumably the year she enters the labor market). For example, if a student graduates in spring 2009, she starts repayment in fiscal year 2009–10 and will be part of the 2010 repayment cohort in our analysis (consistent with U.S. Department of Education terminology). We then plot the percentage of students in each of these repayment cohorts who ever defaulted on at least one loan two-, three-, or five-years after the start of the repayment period, as depicted in the chart below.

Among the 2004 cohort, about 7.5 percent of student loan holders defaulted within two years of leaving school, 10.5 percent defaulted within three years, and 19 percent defaulted within five years. For each cohort default rate (CDR), we see a relatively smooth rising trend across the repayment cohorts until we examine the 2010 cohort (2011 for the two-year CDR), which experienced a sharp increase in the default rate as compared to earlier cohorts. For example the three-year CDR of the 2010 cohort is 18 percent (a 5 percentage point increase over the 2009 cohort) and the five-year CDR of the 2010 cohort is 23 percent (a 3 percentage point increase over the 2009 cohort).
For each of the three series, the highest default rates are faced by the 2011 cohort. The repayment behaviors of subsequent cohorts have improved gradually. It’s important to note that the 2010 and 2011 repayment cohorts likely entered the labor market in 2009 and 2010, respectively. Although the official NBER recession period was December 2007 to June 2009—a period characterized by a steady increase in the unemployment rate—the increase in the default rate here coincides almost exactly with both the peak of unemployment and the trough of aggregate hires, both of which occurred between the end of 2009 and the second half of 2010.
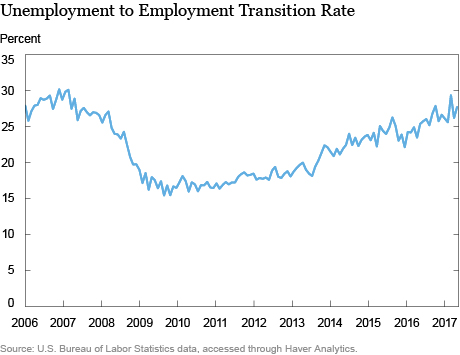
To better capture the labor market activity that recent students would have faced, the chart below illustrates the rate at which unemployed individuals became employed over time. The transition rate was at its lowest between May 2009 and September 2010, with only 15–16 percent of unemployed individuals finding jobs, as compared to nearly 30 percent before the recession. The students in the 2010 and 2011 repayment cohorts likely left school between 2009 and 2010 when unemployed individuals faced the lowest probabilities of being hired.
High default rates in these cohorts likely reflect the trouble these students faced in this labor market after leaving school. Without a job, repaying large student loan balances could have proven difficult or impossible for many students, even as the income dependent repayment programs were being expanded. After 2011, CDRs began to fall as the labor market slowly recovered, although as of the 2014 cohort (the latest cohort for which we can calculate a two-year CDR), they had not yet returned to their pre-crisis levels.

An additional explanation for the high default rates during and following the recession involves the shifting composition of students leaving school and seeking jobs, especially among those leaving two- and less than two-year schools (collectively referred to as “two-year students” in the rest of this post). Previous work has shown that there was a substantial increase in student enrollment during and immediately following the recession period, particularly at for-profit colleges, including two-year for-profit colleges. Students at for-profit schools often come from more disadvantaged backgrounds and may have faced an even more difficult labor market when they left school. In addition, other work has shown that even when controlling for nonrandom selection into for-profit schools, for-profit students tend to face relatively adverse earnings and employment outcomes compared to their counterparts in public schools. This increase in the share of students from two-year for-profit schools entering the labor market around that time could then help to explain the overall large rise in default rates among the 2010 and 2011 repayment cohorts.
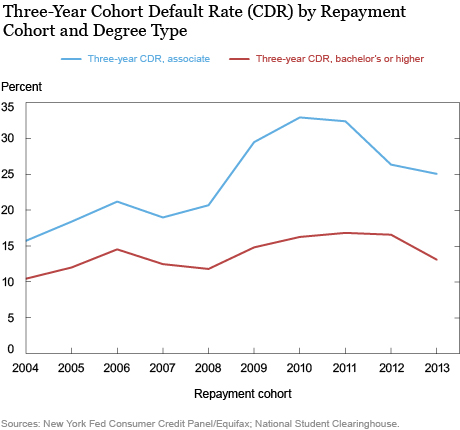
Indeed, the recession did not affect all students in the same way. Students enrolling in different degree programs experienced significantly disparate growth in default rates during and following the recession period. In the chart below, we differentiate students both by repayment cohort and by the degree program they were enrolled in—whether it was an associate degree program, or a bachelors’ or higher-level degree program. Associate degree students defaulted at relatively higher rates regardless of the cohort, but appear to have been considerably more affected by the recessionary labor market than the bachelor’s degree students.
Bachelor’s and higher degree students among the 2008 repayment cohort had a three-year CDR around 11.5 percent; for the 2010 cohort, the default rate had risen 5 percentage points to around 16 percent. For associate students, default rates increased more than 12 percentage points, from around 20 percent for the 2008 repayment cohort to around 32.5 percent for the 2010 repayment cohort. Bachelor’s students also show evidence of a more significant recovery back to pre-crisis levels than associate students: the default rate for bachelor’s students in the 2013 cohort was only ½ percentage point higher than for those in the 2007 cohort while the default rate for associate students remained 6 percentage points above that pre-crisis level. Thus, associate students were markedly more exposed to the recessionary labor market than the bachelor’s students.
Although not reported here, we find a similar picture when we differentiate students by their graduation status, major, type of college or selectivity of school. Regardless of cohort, college dropouts default at higher rates than their degree-earning counterparts but they appear to have been much harder hit by recessionary labor market conditions. Similarly, those studying arts and humanities, attending for-profit institutions, or attending nonselective institutions show markedly larger increases in defaults during and immediately following the recession than their peers.

The recession undoubtedly made the job market more difficult for all recent graduates, but the consequences for student loan borrowers extended far beyond the labor market. Without jobs or with lower-paying jobs, students displayed a reduced ability to repay their loans, defaulting at much higher rates than their pre-recession counterparts. These effects were not homogenous though, education matters substantively: associate degree students, dropouts, arts and humanities students and students who attended nonselective colleges exhibited markedly higher increases in default rates than their corresponding peers. Young people who default on their loans have a much harder time buying a home, buying a car, or taking out loans for future education—all outcomes that have important implications not only for these students, but also for the broader economy.
Disclaimer
The views expressed in this post are those of the authors and do not necessarily reflect the position of the Federal Reserve Bank of New York or the Federal Reserve System. Any errors or omissions are the responsibility of the authors.

Rajashri Chakrabarti is a senior economist in the Federal Reserve Bank of New York’s Research and Statistics Group.

Nicole Gorton is a senior research analyst in the Bank’s Research and Statistics Group.

Michelle Jiang is a senior research analyst in the Bank’s Research and Statistics Group.

Wilbert van der Klaauw is a senior vice president in the Bank’s Research and Statistics Group.
How to cite this blog post:
Rajashri Chakrabarti, Nicole Gorton, Michelle Jiang, and Wilbert van der Klaauw, “Are Student Loan Defaults Cyclical? It Depends,” Federal Reserve Bank of New York Liberty Street Economics (blog), November 22, 2017, http://libertystreeteconomics.newyorkfed.org/2017/11/are-student-loan-defaults-cyclical-it-depends.html.


 RSS Feed
 Follow Liberty Street Economics