In recent months, some analysts and policymakers have raised concerns about the unusually low level of stock market volatility. For example, in the June Federal Open Market Committee (FOMC) minutes “a few participants expressed concern that subdued market volatility, coupled with a low equity premium, could lead to a buildup of risks to financial stability.” In this post, we review this concern and find the evidence on investor complacency is mixed. On one hand, we present a view suggesting that historical volatility may have been abnormally high, rather than current volatility being abnormally low. On the other hand, we find that estimates of the volatility risk premium are somewhat low, which is consistent with the view that investor risk tolerance has increased. We extend this analysis in a related post publishing on Wednesday.
The Low Volatility Puzzle
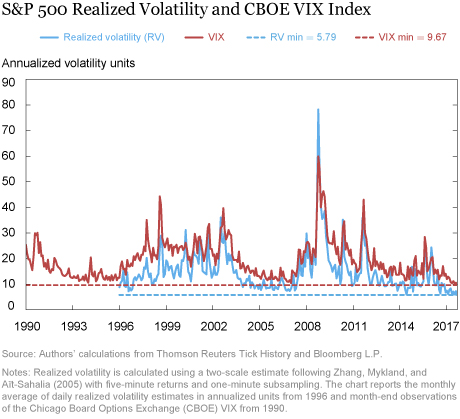
However you measure it, stock market volatility is unusually low. As of September 21, the year-to-date standard deviation of S&P 500 daily returns has been 0.45 percent, the lowest level since 1965 on an annual basis. Intraday volatility is also low. As the chart below indicates, estimates of realized volatility are currently around 6 percent in annualized units, near the minimum of the historical distribution. The chart also reports the Chicago Board Options Exchange Volatility Index (VIX), a market-based measure of implied volatility over a one-month horizon from forward-looking S&P 500 index option prices. Despite a backdrop with high political uncertainty (for example, as measured by Baker, Bloom, and Davis’s economic policy uncertainty index), the VIX is currently around 9-10 percent after hovering near all-time lows for much of 2017.

Common View: Today Is Abnormal and Current Stock Market Volatility Is a Concern
Aside from the FOMC minutes excerpt above, other commentators (for example, see Jeffrey Frankel’s recent blog post) have raised concerns about the low level of stock market volatility, especially given the low level of interest rates, which many associate with investors’ increased willingness to take on risk (or reach for yield). Based on similarities to the low volatility environment before the financial crisis, some suggest that investor complacency may contribute to a major correction in equity markets when volatility returns to a “normal” level.
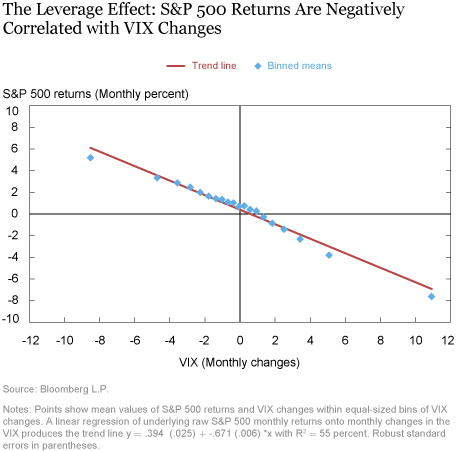
One argument is based on the simple idea that stock market volatility will revert to its historical mean, with equity valuations dropping while volatility “corrects.” In the past, increases in volatility have been negatively correlated with stock market returns. As the chart below shows, if the VIX were to return to a “normal” level closer to its average of around 20 percent since 1990, the S&P 500 index might be expected to decline by 5-10 percent.

While this sounds like a potential warning sign, there are two limitations to the simple mean reversion argument. First, the assumed mean for the VIX is based on a statistical analysis of historical patterns. If the post-crisis regime is different, the “correct” level for the VIX may have changed. Second, even if the mean remains the same, the speed of mean reversion is a key aspect of the risk profile. An increase in the VIX from 10 percent to 20 percent has different implications if the move happens over one week versus one year.
In contrast to mean reversion, the macro-finance literature has raised a more nuanced argument for why low volatility may lead to a buildup of risks to financial stability. In Brunnermeier and Sannikov (2014) and Adrian and Shin (2013) , decreased volatility during business cycle expansions may lead to lower value-at-risk constraints for investors as well as lower margin and collateral requirements. If investors respond by increasing leverage, small shocks to asset prices may suddenly make constraints bind, which can force investors to sell assets, raise volatility, and tighten constraints further. This feedback loop creates risk endogenously, meaning that low volatility in itself can be a catalyst for high future volatility.
Alternative View: Yesterday Was Abnormal and Current Stock Market Volatility Is Not a Concern
To assess the low level of volatility further, it is useful to think about the fundamental sources of stock market volatility that determine its level of mean reversion. According to asset pricing theory, stock prices are equal to the expected value of discounted dividends. As a result, stock price volatility results from either dividend volatility or time-variation in the discount rate used to compute the net present value of dividends.
As discussed in Robert Shiller’s Nobel Prize lecture , the original puzzle in financial economics was why stock prices are so volatile relative to dividends. According to the Gordon growth formula, stock prices and dividends should have the same volatility. In the data, however, stock prices are significantly more volatile than dividends. Since the 1950s, stock prices have exhibited 16 percent annualized volatility. That is almost 10 percentage points higher than the “fundamental” volatility of dividends, which has been closer to 7 percent (for example, see Shiller’s annual data).
Shiller interpreted these results as evidence that stock prices were inefficient, with investors potentially succumbing to animal spirits, or “waves of optimism and pessimism,” to explain the large variation in stock prices (see John Cochrane’s discussion of this view in a Grumpy Economist blog post) . Importantly, however, Shiller’s analysis assumed a constant discount rate for computing net present values. Subsequent work provided evidence against this assumption. Time-varying discount rates are now a standard feature of asset pricing models that can explain the excess volatility of stock prices relative to dividends (see Discount Rates by Cochrane or Monika Piazzesi’s summary of related asset pricing research).
As shown in the previous chart, today’s realized volatility is about 6-7 percent. This level is what one would have originally predicted using the Gordon growth formula, suggesting that the low volatility puzzle is perhaps less puzzling than originally thought. Alternatively, if one subscribes to the more recent asset pricing theories, it appears that current volatility is either abnormally low or that discount rate variation has somehow been dampened, leading us back to concerns about investor complacency.
Evidence on Complacency from the Volatility Risk Premium
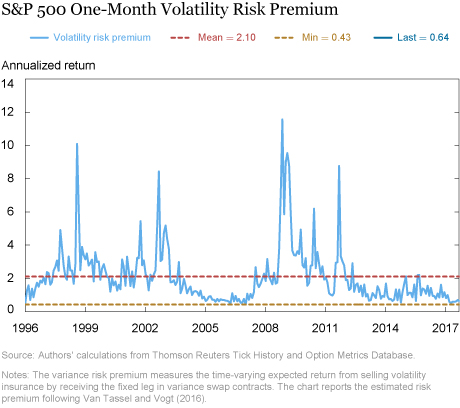
Taking the level of realized volatility as given, one way to gauge investor complacency is through the expected returns that investors demand for selling options. To that end, we decompose the VIX into a one-month volatility forecast and a one-month volatility risk premium using an updated model from Van Tassel and Vogt 2016 (strictly speaking, we estimate the variance risk premium, which is the expected return for receiving the fixed leg in variance swaps over a one-month horizon). The volatility risk premium, plotted in the chart below, represents the time-varying expected return from selling insurance on stock market volatility. The expected returns are positive, reflecting the fact that investors demand compensation for an investment that suffers losses in bad economic states of the world. As noted above, stock prices tend to go down when volatility goes up.
If investors are compressing implied volatility by selling options, we should see this reflected in the estimated volatility risk premium. In the model, we estimate the volatility risk premium to be 0.64 percent as of September 2017. This estimate is below the 2 percent historical average of the volatility risk premium. It also contrasts with the 1 percent upper bound for the volatility risk premium that one can obtain by squaring the VIX, given the VIX’s current level of about 10 percent. Beyond the current level, we can also observe that the volatility risk premium has been below its long-run mean and has exhibited less volatility since around 2012. While low realized volatility may be consistent with the prediction from the Gordon growth model, the volatility risk premium appears to be low both in absolute terms and relative to its historical norm, which may suggest complacency.

Are Investors Complacent? The Evidence Is Mixed
While the low volatility risk premium provides some evidence of complacency, we find the concerns based on the VIX mean reversion argument to be limited. First, it is unclear whether the long-run mean of the VIX is changing over time, especially in the context of the excess volatility puzzle documented by Shiller. Second, while the current level of the VIX is low, it is difficult to pinpoint the horizon over which the VIX may increase (for example, see the large trade in VIX options this July whose payoff expired out of the money in October). An open question is whether investors understand that volatility may be higher in the future. We explore this issue in our next post.
Disclaimer
The views expressed in this post are those of the authors and do not necessarily reflect the position of the Federal Reserve Bank of New York or the Federal Reserve System. Any errors or omissions are the responsibility of the authors.

David O. Lucca is a research officer in the Federal Reserve Bank of New York’s Research and Statistics Group.
 Daniel Roberts is a senior research analyst in the Bank’s Research and Statistics Group.
 Peter Van Tassel is an economist in the Bank’s Research and Statistics Group.
How to cite this blog post:
David O. Lucca, Daniel Roberts, and Peter Van Tassel, “The Low Volatility Puzzle: Are Investors Complacent?,” Federal Reserve Bank of New York Liberty Street Economics (blog), November 13, 2017, http://libertystreeteconomics.newyorkfed.org/2017/11/the-low-volatility-puzzle-are-investors-complacent.html.


 RSS Feed
 Follow Liberty Street Economics
In reply to James Chen: Thank you for your comment. You are correct that the one-month volatility risk premium is only a short-dated measure of expected returns. Our upcoming post on Wednesday will discuss the term structure of implied volatility and risk premia for longer maturities.
The one-month volatility risk premium was at its mean level before the dotcom bubble burst, suggests that the one-month volatility risk premium was not a reliable indicator of market complacency for that specific time period. What is the typical tenor of equity variance swap? around 1 year? the implied volatility risk premium then may not reflect longer term risk appetite, like that of credit spread.