The preceding two posts in this series documented that interest rates on safe and liquid assets, such as U.S. Treasury securities, have declined significantly in the past twenty years. Of course, short-term interest rates in the United States are under the control of the Federal Reserve, at least in nominal terms. So it is legitimate to ask, To what extent is this decline driven by the Federal Reserve’s interest rate policy? This post addresses this question by coupling the results presented in the previous post with those obtained from an estimated dynamic stochastic general equilibrium (DSGE) model.
Using a DSGE model to identify interest rate trends is a good complement to the VAR (vector autoregression) approach implemented in the second post for two reasons. First, the DSGE approach produces an estimate of the natural rate of interest. The natural rate, or r*, summarizes the real (as opposed to monetary) economic forces driving the movements in real interest rates. More formally, we define it as the real return on perfectly safe and liquid short-term assets in an economy without nominal rigidities. Absent such rigidities, monetary policy has no traction on the real economy, and hence on the real interest rate. This is the sense in which r* can be thought as the interest rate that would be observed “in the absence” of monetary policy. Therefore, if its movements coincide with the trend real Treasury rate in the VAR results, conventional monetary policy cannot be their primary driver.
Second, the DSGE approach has the advantage of bringing to bear on the estimation of the natural rate a larger set of economic time series than those included in the VAR exercise. The reason is that the economic structure that characterizes the DSGE model—its so-called microfoundations—provides a tight link between the natural rate, Treasury yields, spreads, and other macroeconomic variables, such as GDP, consumption, and investment. In turn, this link allows us to exploit information from those macroeconomic variables in the estimation of the natural rate. An unavoidable counterpart to these benefits is that the theoretical restrictions embedded in the DSGE model might be incorrect—the model may be misspecified. Therefore, it might fail to properly characterize the dynamics in the data, producing misleading results. In this respect, however, the fact that the DSGE estimates of the trend in the natural rate are very similar to those of the real Treasury rate in the VAR is quite reassuring.
The model underlying the DSGE estimates of the natural rate described below is essentially the same DSGE model as that used for forecasting and policy analysis at the New York Fed. One important addition with respect to the New York Fed DSGE is the introduction of both a liquidity premium and a safety premium in government bonds—the convenience yields that we discussed in the first post of this series. As in the VAR, the movements in these convenience yields are identified by including in the model’s estimation information on the spreads between Aaa and Baa corporate bonds and Treasury securities of comparable maturity. Details on this feature, which we introduced to make the model as comparable to the VAR as possible, as well as details on the rest of the model specification, can be found in our Brookings paper and its appendix. (The code for estimating both the VAR and the DSGE is available on the public hosting service GitHub; we also plan to post there regularly updated estimates of the trend in the real interest rate and r*).
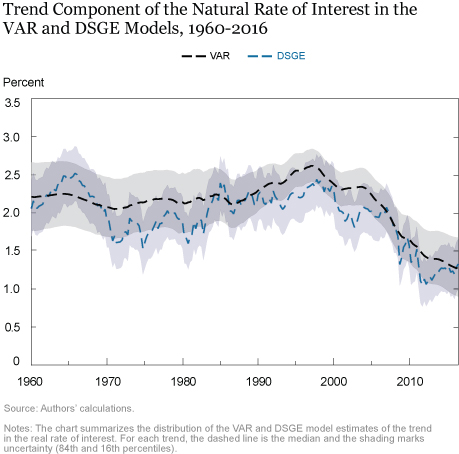
As we will see shortly, the results from the two models are extremely similar, even if the models’ structures and econometric approaches are quite distinct—a finding that corroborates the conclusions presented in the first two posts. The DSGE model produces an estimate of the trend in r* that is extremely similar to the trend real Treasury rate obtained from the VAR (see the chart below, which reports the two trend estimates along with bands that measure our uncertainty regarding those estimates ). Although the DSGE estimates move around a bit more than the smooth VAR trend, their qualitative pattern is essentially the same. Both estimates fluctuate around a constant level somewhat above 2 percent until the late 1990s, after which they decline steadily to their current level of around 1 percent.

The finding that the DSGE model projects sizable fluctuations in the natural rate at very long horizons is in itself surprising. According to the conventional wisdom on estimating the natural rate, DSGE models may be suitable to make inferences about business cycle frequency fluctuations, but they lack the necessary persistence to deliver interesting underlying trend movements. As the chart above shows, this is clearly not the case in our model.
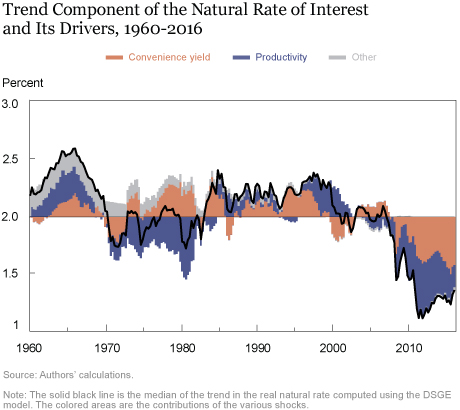
The next chart suggests that the similarity between the two estimates of the trend in the natural rate also extends to the factors that the two models identify as the drivers of this trend. Here, the black line represents the DSGE estimate of the natural rate trend, the same estimate plotted in the previous chart. The orange- and blue-colored areas represent the contributions to this estimate from the convenience yield (recall that we define the natural rate as the return on a perfectly liquid and risk-free asset) and productivity shocks, respectively, while the gray areas represent all other shocks. As in the VAR estimates, convenience yield shocks play a prominent role in this decomposition, especially in accounting for the decline in the natural rate since the late 1990s. Productivity shocks, which in the DSGE model drive the growth rate of the economy in the long term, are also quite important. The reason is that changes in the economy’s potential growth rate affect the trend in the natural rate, as emphasized in the influential work of Laubach and Williams (see these 2003 and 2016 articles) and Holston, Laubach, and Williams.

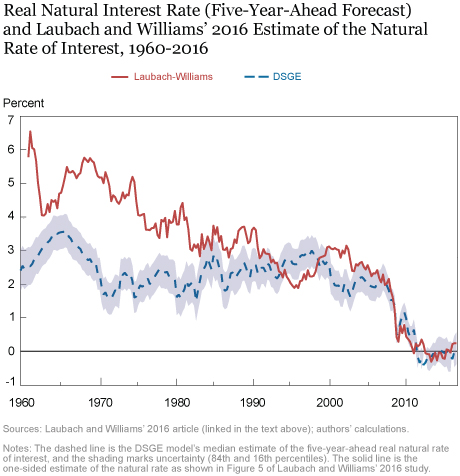
Recognizing the prominence of Laubach and Williams’ estimates of the natural rate in the policy debate, we next compare our results to theirs. Although the two series diverge in the first part of the sample, they provide a very similar account of the evolution of the natural rate of interest since the mid-1980s (see the chart below). In particular, both series capture a very pronounced decline in the natural rate since the late 1990s, with their most recent estimates falling within a small number of basis points of each other. Note, however, that our natural rate series in this chart differs from that used in the first chart, tracing a decline over the past twenty years or so from about 3 percent to less than zero, more than twice as large as in the estimates presented above. The reason is that the estimates below are based on five-year-ahead forecasts of the natural rate while our preferred estimate is based on thirty-year-ahead forecasts in order to focus on very long-run movements in this variable. This evidence therefore suggests that Laubach and Williams’ natural rate tends to emphasize somewhat shorter-run movements in this variable than those identified in our DSGE model. Either way, however, it is remarkable that all three approaches agree that the natural rate is currently at historically low levels, a point affirmed by John Williams in his discussion of our paper.

In conclusion, the bottom line of our three posts is that interest rates on Treasury securities are low not because of monetary policy, but because the natural rate of interest, or r*, is low. Our estimates indicate that the trend in r* fell by about 1 ¼ percentage points since the late 1990s. And the increase in the convenience yield for both safety and liquidity plays a very important role in explaining this decline, as evidenced by the fact that the yields on securities that are not as liquid or safe as Treasuries have declined less over the past two decades.
Disclaimer
The views expressed in this post are those of the authors and do not necessarily reflect the position of the Federal Reserve Bank of New York, the Federal Reserve Bank of Dallas, or the Federal Reserve System. Any errors or omissions are the responsibility of the authors.

Marco Del Negro is a vice president in the Federal Reserve Bank of New York’s Research and Statistics Group.

Domenico Giannone is an assistant vice president in the Bank’s Research and Statistics Group.
 Marc Giannoni is director of research and senior vice president at the Federal Reserve Bank of Dallas.
 Abhi Gupta is a senior research analyst in the Bank’s Research and Statistics Group.
 Pearl Li is a senior research analyst in the Bank’s Research and Statistics Group.
 Andrea Tambalotti is an assistant vice president in the Bank’s Research and Statistics Group.
How to cite this blog post:
Marco Del Negro, Domenico Giannone, Marc Giannoni, Abhi Gupta, Pearl Li, and Andrea Tambalotti, “A DSGE Perspective on Safety, Liquidity, and Low Interest Rates,” Federal Reserve Bank of New York Liberty Street Economics (blog), February 7, 2018, http://libertystreeteconomics.newyorkfed.org/2018/02/a-dsge-perspective-on-safety-liquidity-and-low-interest-rates.html.


 RSS Feed
 Follow Liberty Street Economics