This post presents a quarterly update of the economic forecast generated by the Federal Reserve Bank of New York’s dynamic stochastic general equilibrium (DSGE) model. We describe our forecast very briefly and highlight its change since November 2017.
As usual, we wish to remind our readers that the DSGE model forecast is not an official New York Fed forecast, but only an input to the Research staff’s overall forecasting process. For more information about the model and variables discussed here, see our DSGE model Q & A.
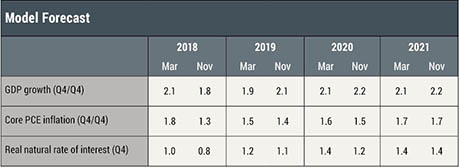
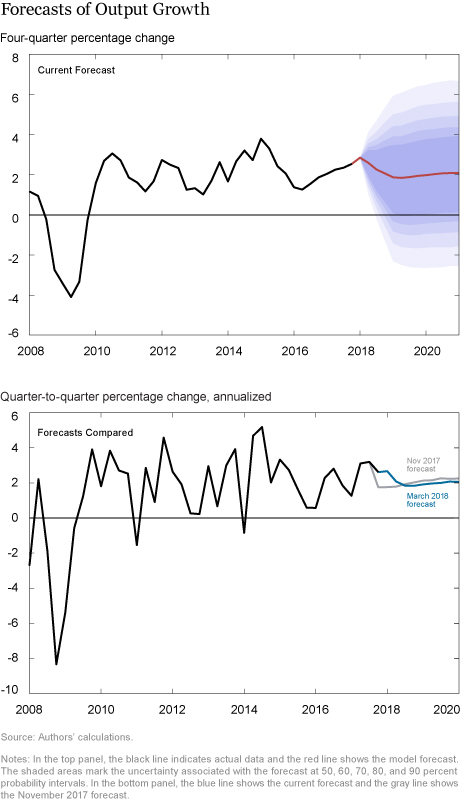
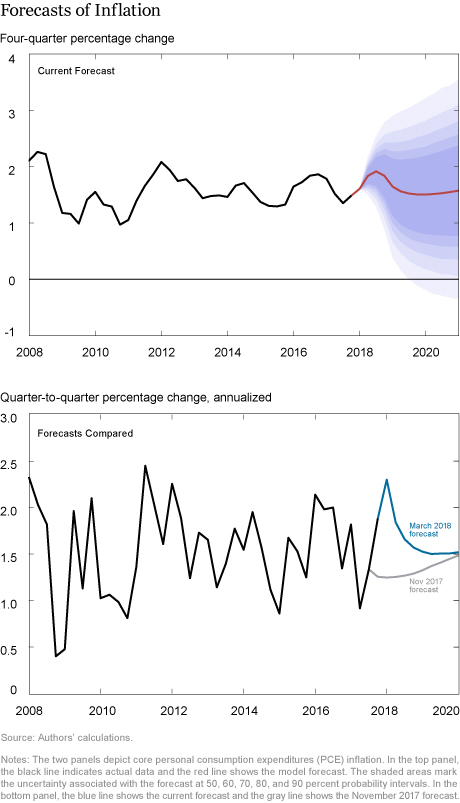
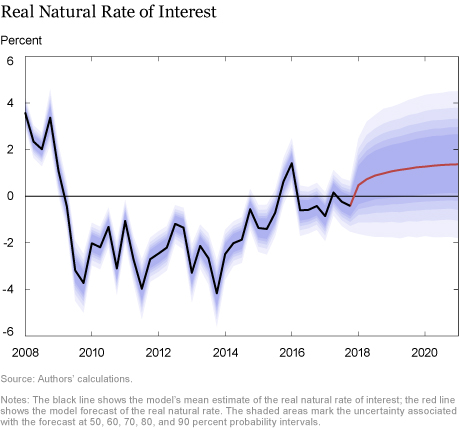
The March model forecast for 2018–21 is summarized in the table below, alongside the November 2017 forecast for the same period, and in the charts that follow. The model uses quarterly macroeconomic data released through the fourth quarter of 2017 and available financial data and staff forecasts through February 21, 2018.


How do the latest forecasts compare with the November forecasts?
- The current Q4/Q4 GDP growth forecast for 2018, at 2.1 percent, is higher than in November. Favorable financial conditions continue to provide stimulus to the economy. Moreover, growth in the fourth quarter of 2017 was stronger than predicted by the model in November. Growth is expected to moderate to 1.9 percent in 2019 before accelerating again to about 2.1 percent in the following years, roughly comparable with the November forecast.
- Short-run inflation forecasts are much higher than they were in November. However, inflation is still projected to decline in the medium run, reaching 1.7 percent in 2021.
- Largely reflecting the continued improvement in financial conditions, the model’s estimate of the real natural rate of interest—the real rate of interest that would prevail in the economy absent nominal rigidities and markup shocks—is higher over the forecast horizon relative to the November estimate. The natural rate is projected to increase throughout the forecast horizon, reaching 1.0 percent at the end of 2018 and 1.4 percent in 2019.
Disclaimer
The views expressed in this post are those of the authors and do not necessarily reflect the position of the Federal Reserve Bank of New York or the Federal Reserve System. Any errors or omissions are the responsibility of the authors.
 Michael Cai is a senior research analyst in the Federal Reserve Bank of New York’s Research and Statistics Group.
 Marco Del Negro is a vice president in the Bank’s Research and Statistics Group.
 Abhi Gupta is a senior research analyst in the Bank’s Research and Statistics Group.
 Pearl Li is a senior research analyst in the Bank’s Research and Statistics Group.
How to cite this blog post:
Michael Cai, Marco Del Negro, Abhi Gupta, and Pearl Li, “The New York Fed DSGE Model Forecast—March 2018,” Federal Reserve Bank of New York Liberty Street Economics (blog), March 9, 2018, http://libertystreeteconomics.newyorkfed.org/2018/03/the-new-york-fed-dsge-model-forecast-march-2018.html.


 RSS Feed
 Follow Liberty Street Economics