As a consequence of the Federal Reserve’s large-scale asset purchases from 2008-14, banks’ reserve balances at the Fed have increased dramatically, rising from $10 billion in March 2008 to more than $2 trillion currently. In that new environment of abundant reserves, the FOMC put in place a framework for controlling the fed funds rate, using the interest rate that it offered to banks and a different, lower interest rate that it offered to non-banks (and banks). Now that the Fed has begun to gradually reduce its asset holdings, aggregate reserves are shrinking as well, and an important question becomes: How does a change in the level of aggregate reserves affect trading in the fed funds market? In our recent paper, we show that the answer depends not just on the aggregate size of reserve balances, as is sometimes assumed, but also on how reserves are distributed among banks. In particular, we show that a measure of the typical trade in the market known as the effective fed funds rate (EFFR) could rise above the rate paid on banks’ reserve balances if reserves remain heavily concentrated at just a few banks.
Note: This analysis provides insight into how the fed funds market might react to changes in the aggregate level of bank reserves. However, as it does not account for all relevant factors, it should not be construed as an analysis of any specific time period. In particular, our analysis does not incorporate the technical adjustment introduced by the FOMC on June 13 that lowered the interest paid on banks’ reserves relative to the top of the target range.
Modelling the Fed Funds Market
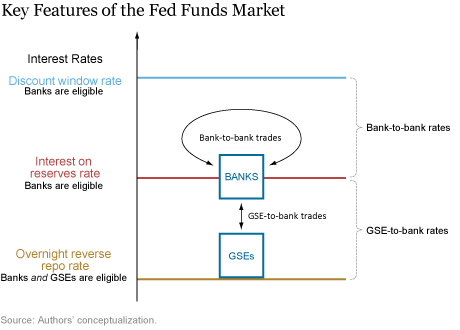
We formalize our argument within the context of a simple model that captures several of the key features of the fed funds market before and after the expansion in aggregate reserves. The diagram below illustrates key features of the fed funds market, along with the policy rates that the Fed sets. We distinguish between banks and government-sponsored enterprises (or GSEs, such as the Federal Home Loan Banks). While we assume that all GSEs are the same, banks differ from one another across a number of dimensions—most importantly, with respect to their reserve holdings. The Fed has paid interest on reserves (IOR) to banks since 2008, but GSEs are not eligible to receive such payments. The Fed offers GSEs (and banks) the possibility of conducting overnight reverse repurchase agreements (ON RRP). Finally, the Fed offers loans to banks at the discount window rate (DW). Currently, the IOR rate is set at 20 basis points above the ON RRP rate and the discount window rate is set at 50 basis points above the top of the target range.

As shown in the diagram, rates in the fed funds market are effectively split into two segments by the IOR rate. GSEs lend to banks that then earn IOR on the additional funds. The agreed rates for these trades are typically between the ON RRP rate (the opportunity cost for the lender) and the IOR (the return for the borrower). In contrast, a trade between two banks has a different rationale. The bank seeking to borrow funds is usually concerned about its liquidity needs and would rather avoid a discount-window loan at a high rate; it is thus willing to pay more than IOR. At the same time, the opportunity cost of funds for the lending bank is the IOR—so the agreed rates will typically be above the IOR for bank-to-bank transactions.
In today’s world of super-abundant reserves, most banks hold far more reserves than required and are not concerned about discount window borrowing. Hence, very few banks are willing to borrow at rates above the IOR rate and there are very few bank-to-bank transactions. As a result, most of the market activity today is driven by banks borrowing from GSEs, the EFFR lies between the ONRRP rate and the IOR rate, and the overall volume is determined by the balances supplied by the GSEs.
What Happens as Aggregate Reserves Decline?
As the level of reserves drops in our model, banks with reserve shortfalls face liquidity needs and resort to borrowing in the fed funds market at rates above the IOR rate to avoid paying higher rates at the discount window. Eventually, lending at “premium” rates becomes attractive to banks with excess reserves. As bank-to-bank trading revives, it puts upward pressure on the EFFR as trade volume shifts away from GSE-bank trades—and thus toward rates above the IOR. At some point, the EFFR rate will drift above IOR. The exact timing of this drift above IOR depends on how the distribution of reserves across banks evolves as the Fed normalizes its balance sheet.
Why Reserve Distribution Matters
The discussion above highlights that within the model a shift from GSE-to-bank trading to bank-to-bank trading will likely be a key driver of higher fed funds rates. This shift only requires that some banks find themselves short of reserves and willing to borrow at rates above the IOR rate. Thus, the distribution of banks—and, in particular, the fraction of banks with low reserves—is as important as the average reserve balance that any bank has (though, of course, the evolution of both are intertwined).
A simple example can illustrate our point. Consider just two banks, A and B, holding $20 and $100 in excess reserves, and assume that banks only seek to borrow funds at a rate above the IOR rate when their excess reserves are zero. In one scenario, aggregate reserves decrease entirely through a reduction in bank B’s balances: Average bank reserves could be as low as $10 per bank before bank B runs out of reserves and starts demanding funds—a drop of more than 80 percent in total reserves. In a second scenario, bank A’s balances absorb the drop in aggregate reserves: Bank A would then start demanding funds above the IOR rate while average bank reserves would still be $50 per bank—a mere 15 percent decrease in total reserves.
This simple example illustrates why the distribution of reserves is one important factor for understanding the effects of normalizing the Fed’s balance sheet. However, a comprehensive analysis of the evolution of the fed funds market requires modeling several other relevant factors, from regulatory considerations to the relative importance of GSE-bank trades going forward. We incorporate these additional factors into our model. But ultimately, key questions on the normalization of the Fed’s balance sheet are quantitative and that’s what our model is for.
Quantitative Scenarios
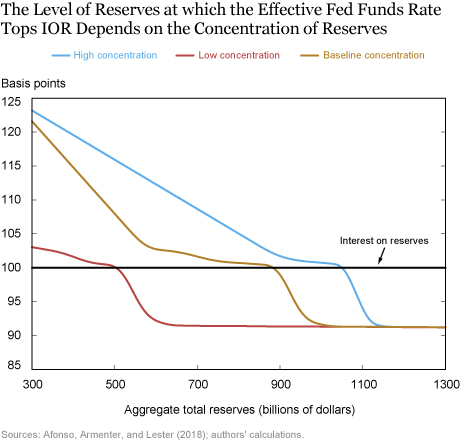
In our baseline simulation, we find that the effective fed funds rate drifts above the IOR rate once aggregate reserves are between $800 billion and $1 trillion. This estimate is significantly larger than the level before the financial crisis. Intuitively, since the fed funds market is quite anemic, GSE-bank trades offer very thin margins for banks, and some trades already occur at rates above the IOR, our analysis suggests that it would not take much for the revival of bank-to-bank trades to outweigh GSE-bank trades.
The predicted path for the fed funds rate as a function of aggregate reserves is shown as a gold line in the figure below. It is worth noting that the model suggests that the EFFR would be near the IOR for a relatively wide range of aggregate reserves, between $600 billion and $900 billion. At this point, lending banks are still flush with reserves, and thus do not demand particularly high rates in return. This would open the possibility of operating the IOR rate as a point target for monetary policy without concerns that temporary movements in aggregate reserves would challenge interest-rate control.
To see how the distribution of reserves impacts rates and volumes in the fed funds market, we study two cases. We first think of a market where reserves are highly concentrated at the largest banks, which choose to hoard them to meet liquidity requirements. This hoarding drives up the demand for reserves by other banks that need to satisfy reserve requirements, which triggers the largest institutions to start lending funds earlier. Since banks would typically lend at rates above the IOR rate, a higher demand for funds and the availability of more lending balances result in higher trading volume and an increase in interest rates. In practice, this all means that if reserves are highly concentrated and the largest banks hoard balances, the EFFR drifts above the IOR rate earlier—at around $1.1 trillion in aggregate reserves, per our analysis (indicated in blue in the chart below).
In contrast, if reserves are more evenly distributed across banks, aggregate reserves would have to decline much more for the bank-to-bank segment of the market to return. Under this “low concentration” scenario, increased trading volume and upward pressure on the effective rate would be delayed as banks would have less incentive to borrow in the fed funds market. As the chart below shows, in the low concentration case (indicated in red) the EFFR reaches IOR at around $500 billion.

To summarize, our analysis reveals that the answer to the question on how changes in the level of aggregate reserves affect trading in the fed funds market is more subtle than it might seem, as one needs to know both the total reserves held by banks and the distribution of those reserves across banks. More generally, this exercise highlights the importance of studying these questions within the context of a model, where the behavior of market participants will respond to changes in the economic environment.
Disclaimer
The views expressed in this post are those of the authors and do not necessarily reflect the position of the Federal Reserve Bank of New York or the Federal Reserve System. Any errors or omissions are the responsibility of the authors.
 Gara Afonso is an officer in the Federal Reserve Bank of New York’s Research and Statistics Group.
Roc Armenter is a vice president and economist at the Federal Reserve Bank of Philadelphia.
Benjamin Lester is a senior economic advisor and economist at the Federal Reserve Bank of Philadelphia.
How to cite this blog post:
Gara Afonso, Roc Armenter, and Benjamin Lester, “Size Is Not All: Distribution of Bank Reserves and Fed Funds Dynamics,” Federal Reserve Bank of New York Liberty Street Economics (blog), July 11, 2018, http://libertystreeteconomics.newyorkfed.org/2018/07/size-is-not-all-distribution-of-bank-reserves-and-fed-funds-dynamics.html.


 RSS Feed
 Follow Liberty Street Economics