China’s population is only growing at a 0.5 percent annual rate, its working-age cohort (ages 15 to 64) is shrinking, and the share of the population that is 65 and over is rising rapidly. Together, these trends will act as a significant restraint on the country’s economic growth. Nonetheless, there are reasons to conclude that growth will remain relatively strong going forward, most notably because the ongoing shift from rural to urban jobs will continue to boost labor productivity for some time to come.
China Has Cashed In on an Enormous Demographic Dividend
Demographics have played a major role in China’s economic dynamism of recent decades, with the country’s GDP growth averaging 10 percent per year from 1979 to 2010. Before this transformational boom period, China population was growing rapidly and the government, over the course of the 1970s, adopted various family planning policies that culminated in the “one child policy” in 1979. These policies contributed to a subsequent decline in the fertility rate, which fell from a bit over six children per woman in 1969 to just under two by 1990.
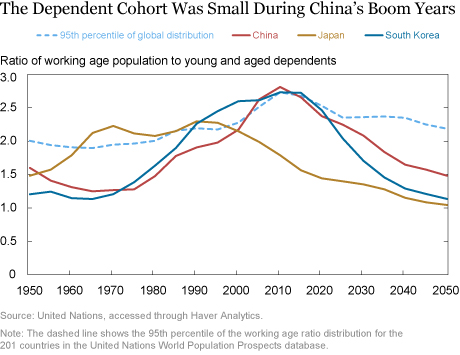
The resultant population dynamics led to a large swing in the ratio of the working-age population to the dependent population (those under 15 and above 64). As illustrated in the chart below, that ratio surged from 1.2 in 1966, when China’s population skewed very young, to a peak of 2.8 in 2010, among the highest ever recorded, as the youth population’s share of China’s overall population shrank and the aged cohort remained stable.

China’s economy earned a “demographic dividend” from having a large decrease in its child-dependent population relative to its working age population, as did the other highly successful economies of East Asia. Research suggests that these economies’ strong growth experiences derived to a significant degree from having unusually large working age populations, in proportional terms.
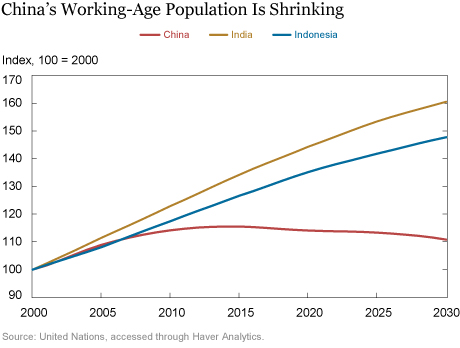
China’s dependency ratio, though, is now set for a steady decline; a United Nations projection traces a slide from 2.5 in 2017 to 2.1 in 2030 and 1.5 in 2050. Specifically, the working-age population is shrinking while the share of the population aged 65 and over is surging. Such a decline in a developing country’s working-age cohort is unusual, as reflected in the chart below. It compares the U.N. projection for China’s working-age cohort with those for India and Indonesia, the second and third most populous developing countries, respectively. Both of those countries are expected to see their working-age populations grow at 1 percent per year over the next ten years.

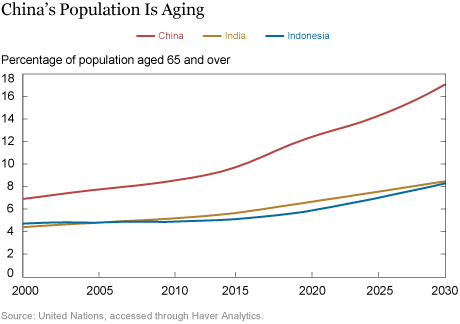
The aging of the population is also pushing China’s dependency ratio down. The share of the population that is 65 and over rose from 7 percent in 2000 to 10 percent in 2015. It is projected to surpass 17 percent by 2030. Again, the projected trends for India and Indonesia are quite different, with the 65 and over cohorts in both countries only rising from 5 percent in 2015 to 8 percent in 2030.

Will the End of the Demographic Boom Lead to a Growth Bust?
Having fewer workers supporting an ever-growing retired population will certainly be a challenge for China’s economy. But headwinds to China’s growth from demographics trends will likely be partially offset, as seen in Japan, by people working longer. Indeed, the country has young official retirement ages—60 for men and as low as 50 for some women in factory jobs—and expectations are that these will be increased for those who want to work longer.
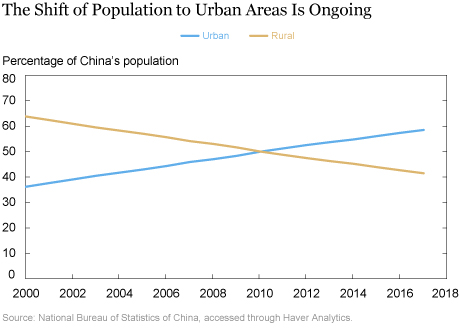
Ultimately, the strongest growth counterbalance to the country’s demographic shift will likely be in policies aimed at supporting sustainable urbanization. As seen in the chart below, the share of China’s population living in urban areas has increased from 36 percent in 2000 to 59 percent in 2017. (Note that urbanization has been driven by both the migration of people from rural areas and by the expansion of urban areas into the surrounding countryside.)

Viewed from the perspective of labor supply, a continued population migration to urban areas will support growth because the country’s labor productivity is boosted when workers switch to urban jobs that are typically much more capital intensive than rural/agricultural jobs. Indeed, this shift from rural to urban employment explains how China has devoted, on average, 40 percent of its GDP to physical investment spending over the past thirty years. Even though China’s investment rate peaked in 2011 and is now gradually declining as its economy “rebalances” toward consumption, urbanization should support relatively high investment rates and productivity growth going forward.
The consensus that China’s trend growth will stabilize at somewhat below 6 percent over the medium term implies a substantial continued increase in output per capita given that the population is set to increase by only 0.3 percent per year over the next five years. Such an outlook rests on a reasonable assumption that the gains from urbanization are far from complete.
Demographic Trends Also Represent a Fiscal Challenge
Strong growth will help China deal with the strains of population aging on its fiscal resources and social safety net. In particular, the safety net is now modestly funded, with government spending highly skewed toward investment spending and social safety net spending less than half the average level among developed countries. Part of the problem is that the country’s highly decentralized fiscal structure puts about 85 percent of government spending responsibilities on local governments, which often have limited revenue sources.
The rapid aging of China’s population will put greater pressure on the authorities to meet the demographic transformation with a mix of higher taxes and a shift from investment spending to social spending. Managing this fiscal adjustment will be part of the country’s overall challenge of sustaining high per capita growth in a government-driven economic system.
Disclaimer
The views expressed in this post are those of the authors and do not necessarily reflect the position of the Federal Reserve Bank of New York or the Federal Reserve System. Any errors or omissions are the responsibility of the authors.
 Hunter L. Clark is an assistant vice president in the Federal Reserve Bank of New York’s Research and Statistics Group.
 Thomas Klitgaard is a vice president in the Bank’s Research and Statistics Group.
How to cite this blog post:
Hunter L. Clark and Thomas Klitgaard, “Will Demographic Headwinds Hobble China’s Economy?,” Federal Reserve Bank of New York Liberty Street Economics (blog), August 15, 2018,
http://libertystreeteconomics.newyorkfed.org/2018/08/will-demographic-headwinds-hobble-chinas-economy.html.


 RSS Feed
 Follow Liberty Street Economics