With the arrival of Bank President John Williams from the San Francisco Fed, we’re now running—and sharing the output of—models he helped develop to obtain estimates of the natural rate of interest, or r-star, for the United States and other advanced economies. In the models’ definition, r-star is the real interest rate that allows an economy to expand in line with its underlying potential while keeping inflation stable.
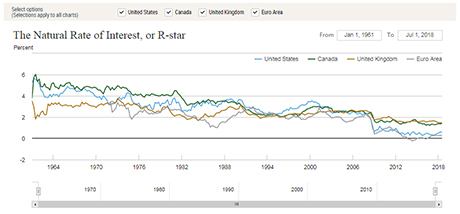
As our sister Reserve bank did in prior years, we’re providing quarterly estimates of r-star and related variables on our public website in downloadable Excel files plus the replication code and documentation for both the Laubach-Williams (“LW”) and Holston-Laubach-Williams (“HLW”) models. Our presentation also offers a new feature, a visualization of the data from 1961 through the present (seen in the illustration below), which helps highlight trends. While we acknowledge ongoing debate about r-star modeling strategies and the measure’s usefulness as a benchmark for guiding monetary policy, we present the data without comment.

The web feature’s interactivity permits users to narrow their focus to specific time periods with timeline controls; right-clicking on a date along a trend line reveals an estimate’s specific point value. On the LW side, which presents data for the U.S. economy, it is possible to toggle between “one-sided” (Kalman-filter) and “two-sided” (Kalman-smoother) estimates of the model’s state variables: r-star, trend growth, and the output gap. On the HLW side, which presents an international view, users can show or hide data from each of the four covered regions: United States, Canada, the United Kingdom, and the Euro Area.
We plan to update estimates on a quarterly basis, tying our calendar to the official GDP release schedules for the United States (LW) and Canada (HLW). Check out the web feature for the release dates as well as links to in-depth explanations of the methodology.
Disclaimer
The views expressed in this post are those of the author and do not necessarily reflect the position of the Federal Reserve Bank of New York or the Federal Reserve System. Any errors or omissions are the responsibility of the author.
Anna Snider is a cross-media editor in the Federal Reserve Bank of New York’s Research and Statistics Group.
How to cite this blog post:
Anna Snider, “Just Released: Interactive R-star Charts,” Federal Reserve Bank of New York Liberty Street Economics (blog), December 5, 2018, https://libertystreeteconomics.newyorkfed.org/2018/12/just-released-interactive-r-star-charts.html.


 RSS Feed
 Follow Liberty Street Economics