Oil prices and the exchange rate of the U.S. dollar against the euro have often moved together over the past decade or so, but it is not at all clear why they should. The standard interpretation of oil price movements as a response to global oil supply and demand shifts makes it unlikely that the correlation stems from the dollar’s effect on oil prices. In addition, the notorious difficulty in predicting currency moves makes it hard to believe that oil prices dictate the dollar’s value. Improbability aside, however, in this blog post we document the tendency for the value of the dollar to rise relative to European currencies when oil prices fall, and we consider a possible explanation for the correlation.
A Recent Correlation
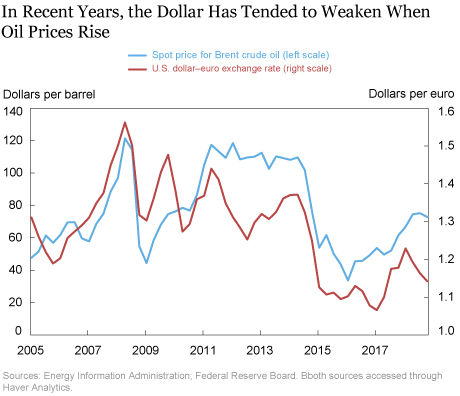
The pattern of the dollar weakening when oil prices move higher starts around 2005. The chart below considers oil prices and the dollar exchange rate against the euro at a quarterly frequency. (The chart uses dollars per unit of foreign currency as the exchange rate measure, so an increase represents a weaker dollar.) The correlation was particularly noticeable in the 2006-10 and 2014-18 periods. Not shown are the data for the 1980s and 1990s, since no correlation is evident during these periods of oil price stability.

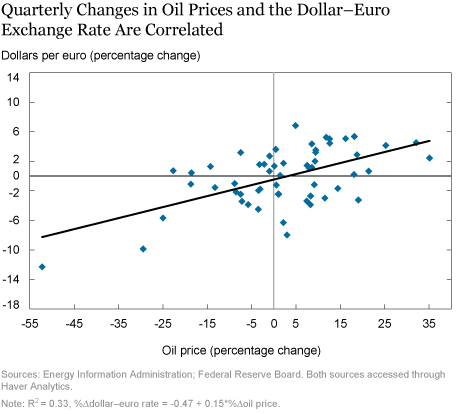
The next chart converts the data into percentage changes, with the plotted line representing a simple regression result. The estimated coefficient suggests that a 10 percent increase in oil prices is associated with a 1.5 percent depreciation of the dollar against the euro. Over the 2005-18 period, oil price movements can explain 33 percent of the quarterly moves in the dollar–euro exchange rate as measured by the R-squared statistic. Note that the correlation is much weaker if the regression is done using monthly data, with the R-squared falling to 14 percent, and it becomes negligible for weekly and daily changes. One explanation for the dependence of the result on the frequency of observations is that using averages over a longer time horizon filters out nonpersistent, “noisy” currency and oil price movements.

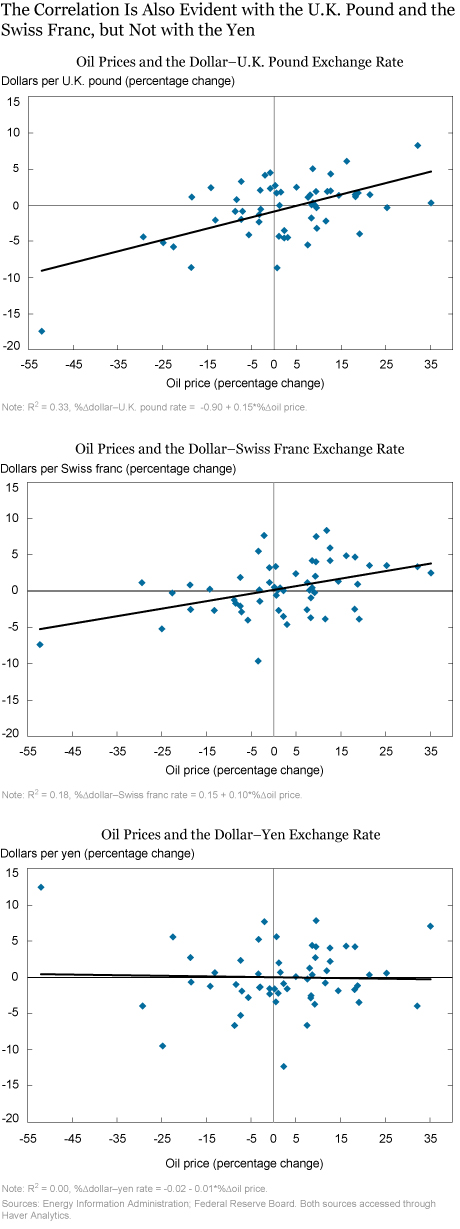
The next set of charts shows that the relationship with oil prices is similarly strong for the exchange rate of the U.S. dollar against the U.K. pound and only a bit weaker for the dollar–Swiss franc rate. The yen–dollar rate, however, stands out for displaying no correlation with oil prices. So, the pattern is evident for the dollar against European currencies but not against the yen.

Does the Dollar Drive Oil Prices?
Available data make it possible to attribute oil price movements to supply and demand developments. For example, in the first half of 2018, oil prices moved up as increased demand in China and India, coupled with a drop in Venezuela’s production, was enough to cause inventories to fall despite higher production in North America.
The four large oil price swings since the mid-2000s, all matched by moves in dollar exchange rates against European currencies, can be similarly explained by using supply and demand data. Specifically, the pre-2009 run-up in oil prices was influenced by fast global oil demand growth and declining U.S. oil production. The subsequent drop in prices proceeded from a fall in oil demand during the global financial crisis, and the subsequent rebound in oil prices in 2010 and 2011 was attributable to the recovery in global oil demand, most notably in China, and only a small increase in OPEC production. Finally, the drop in prices in late 2014 followed a jump in Saudi production as authorities decided to staunch the loss of market share from higher North American production.
It’s possible that changes in oil demand, particularly during the global financial crisis, affected other factors that then influenced the dollar exchange rates against European currencies, but it is not clear what factor would play out as differences between the United States and Europe. Why would an increase in Asian oil demand put downward pressure on the dollar against the euro area? Why would an increase in Saudi production cause the dollar to strengthen?
Searching for an Explanation
Various arguments might be advanced for why oil prices could affect the dollar’s exchange rate with European currencies. One argument is that higher oil prices lower expected U.S. output growth relative to Europe’s, putting downward pressure on the dollar. It is true that Europe tends to tax gasoline much more heavily, so that changes in crude oil prices have a more modest impact on consumers and firms than in the United States. Still, it is hard to make the case that the more modest energy price swings in Europe have that much impact on the relative output/interest rate expectations of the two regions.
The correlation could also arise because oil-exporting countries (say, Saudi Arabia) put a higher share of their cross-border investments into European assets than do oil-importing countries (say, China and Japan), so the transfer of income to oil exporters when oil prices rise reduces the demand for dollars. This may be because Middle East oil producers invoice their exports in dollars but buy more goods and services produced in Europe than in the United States. For this reason, they may be relatively more prone to buy European assets than other major cross-border investors like China.
The fact that oil-exporters were not major cross-border investors until the 2000s fits the timeline of when the dollar-oil price correlation appeared. IMF data show the North Africa/Middle East region running current account deficits in the 1980s and 1990s, indicating that this region was borrowing rather than investing in the rest of the world. The balance turned into a $77 billion surplus in 2000 in response to a 50 percent increase in oil prices over the previous two years. The upward trend in oil prices eventually pushed the balance to $340 billion in 2008. The rate of foreign investment by oil exporters has since then moved in step with oil prices, falling to $44 billion in 2009, jumping to $414 billion in 2012, and collapsing into net selling territory in 2015. This narrative may also clarify why the correlation is most noticeable during the large oil price swings, since these were also periods when the volume of cross-border purchases of financial assets changed most.
Conclusion and Caveat
The observed correlation between oil prices and the dollar is difficult to explain. The argument underlying this blog post is that it is unlikely that changes in the dollar drive changes in oil prices. So, why would changes in oil prices cause changes in exchange rates? Or is it that there are other variables that systematically influence both, creating the observed correlation? We have considered a number of possible narratives, suggesting some paths for future research. Of course, the caveat is that the correlation has not been around for very long, so one should be cautious in reading too much into it. The longer this correlation persists, however, the more it will deserve a convincing explanation.
Disclaimer
The views expressed in this post are those of the authors and do not necessarily reflect the position of the Federal Reserve Bank of New York or the Federal Reserve System. Any errors or omissions are the responsibility of the authors.

Thomas Klitgaard is a vice president in the Federal Reserve Bank of New York’s Research and Statistics Group.
 Paolo Pesenti is a senior vice president and monetary policy lead in the Federal Reserve Bank of New York’s Research and Statistics Group.
 Linda Wang is a senior research analyst in the Bank’s Research and Statistics Group.
How to cite this blog post:
Thomas Klitgaard, Paolo Pesenti, and Linda Wang, “The Perplexing Co-Movement of the Dollar and Oil Prices,” Federal Reserve Bank of New York Liberty Street Economics (blog), January 9, 2019, https://libertystreeteconomics.newyorkfed.org/2019/01/the-perplexing-co-movement-of-the-dollar-and-oil-prices.html.


 RSS Feed
 Follow Liberty Street Economics
The arbitrage “explanation” does not apply. There is no such thing as an oil market price in euro. Most likely, we are faced with some sort of self-fulfilling matter. People do believe in the link. Therefore, they will incorporate in their oil pricing strategy (read now algorithm) the “correction”. If dollar goes up, take bearish positions and conversely. And the link becomes real.
We agree that higher oil prices give oil producers more cash to invest abroad and much of that likely goes into dollar assets. Our argument is that the pattern of the dollar weakening when oil prices rise suggests that the redistribution of revenue from oil importers to oil exporters tilts global cross-border purchases towards European assets.
I’m surprised you don’t address the simple point of pricing. If the $ falls 10% against the euro, then the oil price in $ needs to rise 10%, or the euro oil price needs to fall 10%, or something in between. If they don’t do this then there will be an arbitrage. Similarly the price of French housing in US dollars is almost 100% correlated with the USD EUR rate.
A high oil price would be expected to support the US dollar by two key mechanisms, both through a financial channel and through trade channel. Financially: due to the high volatility of oil prices, oil states tend to hedge by buying up financial assets when the oil price is high, and selling those assets when the oil price is low. The US presents the largest open financial market, with the added advantage of being USD-denominated, and so is the most heavily traded and owned by oil-producing countries. Result: when the oil price rises, there is a surge in demand for dollars, to buy dollar-denominated financial assets. When the oil price falls, oil producing countries sell their US financial assets, and then sell the dollars to buy their own currencies (or to buy euros and renminbis to pay for imports). Trade: the trade channel is less important, but still matters (mostly because it used to work in the opposite direction to the capital channel, but has probably now gone limp). Shale has helped US oil production boom to around 11 million barrels/ day, which at a $50 oil price would mean $200 bn. With total US imports at $2.12 tn and total US exports at $1.32 tn, so a net trade balance of -$0.80 tn, a product as intensely traded and valuable-in-aggregate as oil also has a meaningful impact on trade related demand for dollars. If oil prices rise, that increases expected oil production in the US, leaving the dollar value of net oil imports at roughly the same level.
The International Energy Agency publishes its Oil Market Report on a monthly basis. The report contains tables with supply and demand data and includes commentary about how supply and demand factors are affecting oil prices.See https://www.iea.org/oilmarketreport/omrpublic/ For another perspective on how oil supply and demand developments affect oil prices, see FRBNY’s Oil Price Dynamics Report. https://www.newyorkfed.org/research/policy/oil_price_dynamics_report
Quoting your article: “….Available data make it possible to attribute oil price movements to supply and demand developments….” I’ve been searching for useful oil supply and demand data for a long time. I have never found any data that supports the above quote. Can you provide references to the data that you’re referring to? Can you also supply links to articles that support the above quote? Thanks, Bill