Today we are releasing new data on individuals’ experiences and expectations regarding household spending. These data have been collected every four months since December 2014 as part of our Survey of Consumer Expectations (SCE). The goal of this blog post is to introduce the SCE Household Spending Survey and highlight some of its features.
While the SCE Household Spending Survey shares design features with the main SCE—both pose probabilistic questions to a rotating panel of respondents—the information it collects is unique in several respects. First, it records detailed information about expectations for year-ahead changes in household spending (both in aggregate and by category), spending on essential and non-essential items, and the likelihood of making large purchases of various types. We also solicit information on the expected spending and saving response to an unanticipated increase or decline in household income. Turning to experiences, we also ask respondents about large purchases and changes in total spending over the past year, as well as the degree of month-to-month variability observed in their household incomes.
The data, together with a companion set of interactive charts (covering a subset of the data we collect), will be published every four months on the website of the New York Fed’s Center for Microeconomic Data going forward. As with other components of the SCE, we report statistics not only for the overall sample, but also for various demographic categories, namely age, education, household income, numeracy, and Census region. The underlying micro (individual-level) data for the full survey will be made available with a lag.
The remainder of this blog post discusses three series from this new dataset. Interested readers can view additional charts on the release webpage.
Spending Growth Expectations
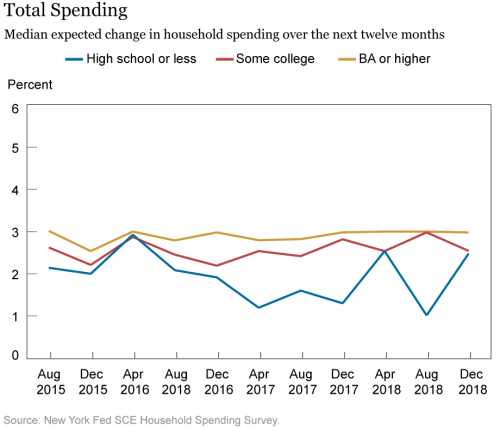
In our survey, we ask individuals to assign probabilities to possible outcomes of changes in their future household spending. More specifically, we ask for the percent chance that, over the next twelve months, the respondent’s change in household spending will fall into each of ten intervals or “bins”: -2 percent to 0 percent, 0 percent to 2 percent, etc. By eliciting respondents’ density forecasts in this way, we are able to measure not just the central tendency of their expectations but also their degree of uncertainty about future outcomes. As described in our background paper, we use each respondent’s bin probabilities to estimate the respondent’s density forecast, from which we then compute its mean, representing the expected spending growth rate. The chart below depicts the median of these expected spending growth rates since the start of the survey. The series is further broken down by education level.
While spending growth expectations overall have been fairly stable during the period, the chart reflects a divergence after April 2016; individuals with a high school diploma (or less) lowered their spending growth expectations during 2016 and 2017, while those of respondents with more education remained largely stable at a higher level. When differentiating by age, we see a similar pattern, with spending growth expectations lagging somewhat for younger individuals (forty years old or less).
We collect similar information on the likelihood of making large purchases across a range of categories, such as electronics, furniture, vacations, home appliances, vehicles, home repairs, and homes or apartments. Our preliminary analysis also indicates that these expectations predict actual future spending, both at the aggregate and individual level, underscoring the value of collecting such data.
Income Variability
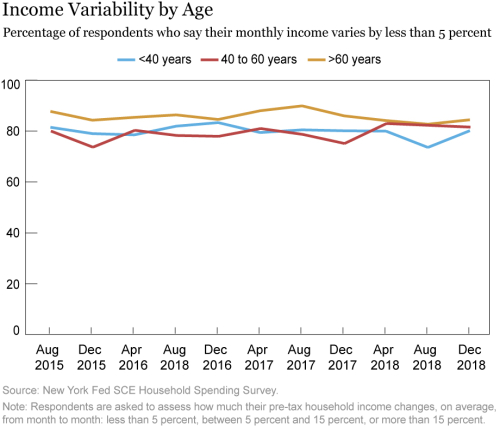
Another feature of our survey is that it provides a measure of income variability by asking respondents by how much their pre-tax household income changes, on average, from month to month: less than 5 percent, between 5 percent and 15 percent, or more than 15 percent. The chart below displays the percentage of respondents reporting variation of less than 5 percent, broken down by age. Somewhat surprisingly, we see little heterogeneity across age groups, with about 80 percent of respondents in each age group reporting very stable monthly income. We similarly find little heterogeneity and time variation in the shares reporting monthly income variability of 5-15 percent (15 percent of respondents) and more than 15 percent (5 percent of respondents). The homogeneity of income variability across age groups is also seen when differentiating respondents by education and income levels.
Spending Responses to Income Shocks
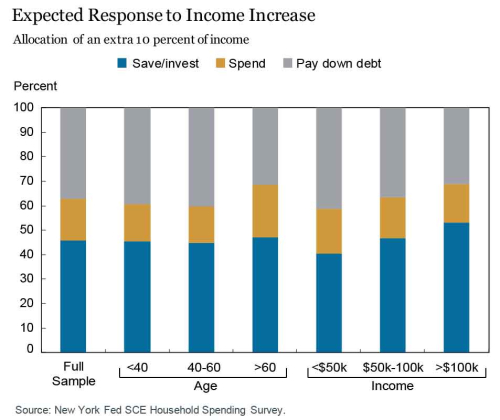
A third unique feature of our survey is that we elicit information that can be interpreted as a measure of a consumer’s marginal propensity to spend or save. More specifically, we ask respondents to imagine that next year they find their household with 10 percent more income than they currently expect, and ask what fraction of that extra income they would (i) save or invest, (ii) spend or donate, and (iii) use to pay down debts. The next chart shows the average allocation for each category as measured in December 2018, by age and income group.
Overall, respondents would expect to spend 17.2 percent of the extra income, using the rest to pay down debt (37.0 percent) or save and invest (45.7 percent). This breakdown has been very stable since we started collecting these data in August 2015.
Comparing responses across age and income groups, the propensity to spend extra income is relatively constant, with older respondents (age 60 or over) reporting a slightly higher rate (21.5 percent) than those between 40 and 60 (14.9 percent) or younger than 40 (15.1 percent). The share of extra income used for consumption is also slightly higher among respondents with lower incomes—18.4 percent for those earning less than $50,000, versus 15.7 percent among those with incomes above $100,000. There are somewhat larger differences across groups in the income shares used to pay down debt and to save or invest, with debt payments being more prevalent among lower income and younger respondents, while saving and investing is more common for older and higher income respondents.
Finally, we also ask about expected behavioral responses to an unanticipated 10 percent drop in year-ahead household income. In that case we find a much higher response in spending, with reduced spending covering, on average, 75.4 percent of the income loss, reduced saving covering 20.1 percent, and increased borrowing covering 4.5 percent. We again find modest heterogeneity in responses across demographic groups, with smaller spending cuts reported at higher levels of age, education, and income. The asymmetry in responses to unexpected income gains and losses is consistent with evidence we have presented earlier and with findings in the literature on spending behavior.
Conclusion
The SCE Household Spending Survey provides a comprehensive picture of consumers’ experiences and expectations regarding household spending. These data can help shed light on the dynamics and near-term trajectory of overall consumption in real time. We believe that this new dataset will be valuable to the policy and research communities alike, enabling them to better understand household spending behavior.
CMD Resources
SCE Household Spending Survey: Interactive Results
Analysis: Saving and Spending
Background: Survey of Consumer Expectations
Disclaimer
The views expressed in this post are those of the authors and do not necessarily reflect the position of the Federal Reserve Bank of New York or the Federal Reserve System. Any errors or omissions are the responsibility of the authors.
 Gizem Kosar is an economist in the Federal Reserve Bank of New York’s Research and Statistics Group.
 Kyle Smith is a senior research analyst in the Bank’s Research and Statistics Group.
 Wilbert van der Klaauw is a senior vice president in the Bank’s Research and Statistics Group.
How to cite this blog post:
Gizem Kosar, Kyle Smith, and Wilbert van der Klaauw, “Just Released: Introducing the SCE Household Spending Survey,” Federal Reserve Bank of New York Liberty Street Economics (blog), February 19, 2019, https://libertystreeteconomics.newyorkfed.org/2019/02/just-released-introducing-the-sce-spending-survey.html.


 RSS Feed
 Follow Liberty Street Economics