As we outlined in our previous post, the United States lost close to six million manufacturing jobs between 2000 and 2010 but since then has gained back almost one million. In this post, we take a closer look at the geographic dimension of this modest rebound in manufacturing jobs. While job losses during the 2000s were fairly widespread across the country, manufacturing employment gains since then have been concentrated in particular parts of the country. Indeed, these gains were especially large in “auto alley”—a narrow motor vehicle production corridor stretching from Michigan south to Alabama—while much of the Northeast continued to shed manufacturing jobs. Closer to home, many of the metropolitan areas in the New York-Northern New Jersey region have been left out of this rebound and are continuing to shed manufacturing jobs, though Albany has bucked this trend with one of the strongest performances in the country.
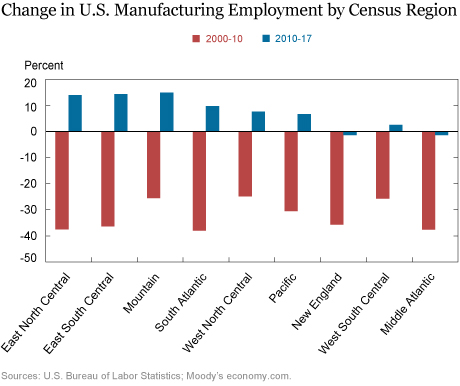
To illustrate where jobs have been growing and declining, the chart below shows the percentage change in manufacturing employment by census region from 2000 to 2010 and from 2010 to 2017. Declines were significant for every region of the country between 2000 and 2010, though there were some notable differences. While employment fell 30 to 40 percent in most regions, the Mountain, West North Central, and West South Central regions saw more modest declines.

As manufacturing employment began to expand for the nation as a whole during the early stages of the recovery from the Great Recession, some parts of the country did better than others. Job growth in the Mountain, East South Central, and East North Central regions outpaced that of other regions. The East South Central and East North Central regions encompass an area often referred to as “auto alley,” where a large portion of the country’s light vehicle production takes place. Manufacturing job growth in auto alley was particularly strong, in large part because of recent growth in the transportation equipment sector, as we described in our previous post. Meanwhile, the Northeast—specifically, the Middle Atlantic and New England regions—continued to shed manufacturing jobs after 2010.
A Shifting Locus of U.S. Manufacturing Jobs
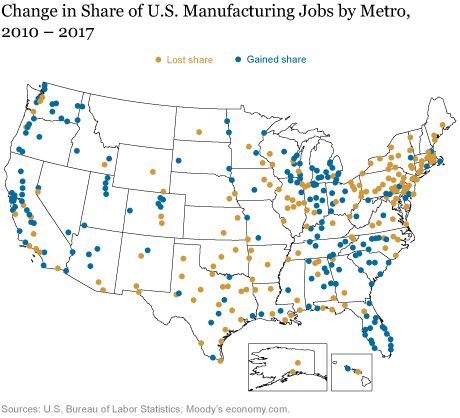
The uneven rebound in manufacturing jobs across local labor markets has continued to change where the country’s manufacturing base is located. The map below shows how the share of manufacturing jobs among metropolitan areas changed between 2010 and 2017. We divide each metro’s manufacturing employment by the national total. Metropolitan areas that saw a decline in this share are shown in gold, while places that increased their share are shown in blue. Continuing a decades-long trend, much of the Northeast and many parts of the Midwest saw their shares of the nation’s manufacturing jobs decline, while auto alley, parts of the South, and much of the West Coast saw their shares increase.

The New York-Northern New Jersey Area Continues to Lose Ground
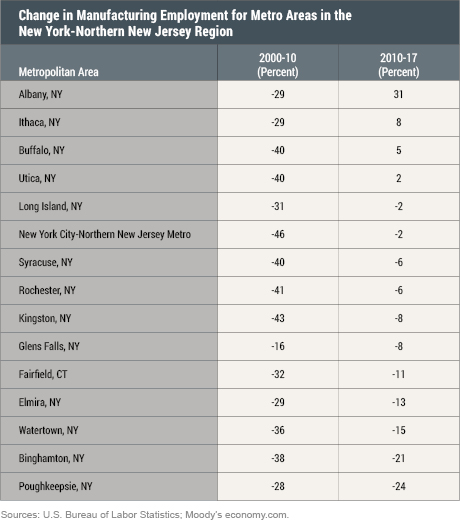
Below, we show the change in manufacturing jobs for the 2000-2010 and 2010-2017 periods for metro areas in the New York-Northern New Jersey region. The decline in manufacturing jobs between 2000 and 2010 was quite severe for most of the region’s metros, ranging from 16 percent in Glens Falls to 46 percent in the New York City-Northern New Jersey metro area. Many of the metropolitan areas in upstate New York experienced declines of 40 percent or more, enormous declines for such a short period. As manufacturing employment began to rebound nationally in 2010, the region did not fare particularly well, with substantial losses continuing in some places and only a few metro areas seeing any net manufacturing job growth at all.

Some of the worst job losses from 2010 to 2017 occurred in the Southern Tier region—Binghamton and Elmira—as well as in Poughkeepsie. In fact, Binghamton and Poughkeepsie saw declines of more than 20 percent over this period, the fourth- and sixth-worst metro area performances in the country, respectively. The main culprit in these areas was the computer and electronics industry, which, as we showed in our last post, continued to shed jobs between 2010 and 2017. Many of these job losses accrued to companies involved in defense contracts, as some of these firms saw their business decline due to public sector spending cuts, and to local remnants of IBM—once a major employer in both Binghamton and Poughkeepsie. This industry was also responsible for substantial job losses in the New York City-Northern New Jersey metro area.
At the other end of the spectrum, Albany saw its manufacturing job base grow by nearly a third between 2010 and 2017, which was among the largest gains in the country over the period. This job growth largely reflects the successful establishment of a nanotechnology cluster and related semiconductor chip manufacturing in the Capital region.
Other parts of upstate New York fell between these extremes. Buffalo managed a small net gain in manufacturing jobs between 2010 and 2017, led by solid job growth in its transportation equipment sector, which focuses on auto parts and aerospace. Utica also eked out a small gain, partly owing to job growth in its computer and electronics sector (contrary to the national trend), as well as solid gains in metals and machinery—a long-held strength for the Mohawk Valley region. By contrast, Rochester’s manufacturing job base continued to shrink, led by an ongoing decades-long decline in jobs at Eastman Kodak as well as job losses in its transportation equipment sector, bucking the national trend. On a more positive note, Rochester, like other parts of the country, did see substantial job growth in its food and beverage industry. In Syracuse, the electrical equipment industry was a major source of manufacturing job losses.
All in all, as the nation’s manufacturing job base has grown over the past several years, it has actually continued to decline in most of the metro areas in the New York-Northern New Jersey region, with the notable exception of Albany. While much of the Northeast has suffered similar declines, places that are home to manufacturing industries that are growing jobs—like nanotech in Albany or auto-related production in parts of Ohio and Indiana—have been more fortunate.
Disclaimer
The views expressed in this post are those of the authors and do not necessarily reflect the position of the Federal Reserve Bank of New York or the Federal Reserve System. Any errors or omissions are the responsibility of the authors.
 Jaison R. Abel is an assistant vice president in the Federal Reserve Bank of New York’s Research and Statistics Group.
 Richard Deitz is an assistant vice president in the Bank’s Research and Statistics Group.
How to cite this blog post:
Jaison R. Abel and Richard Deitz, “Where Are Manufacturing Jobs Coming Back?,” Federal Reserve Bank of New York Liberty Street Economics (blog), February 6, 2019, https://libertystreeteconomics.newyorkfed.org/2019/02/where-are-manufacturing-jobs-coming-back.html.


 RSS Feed
 Follow Liberty Street Economics