Unemployment risk constitutes one of the most significant sources of uncertainty facing workers in the United States. A large body of work has carefully documented that job loss may have long-term effects on one’s career, depressing earnings by as much as 20 percent after fifteen to twenty years. Given the severity of a job loss for earnings, an important question is how much such an event affects one’s standard of living during a spell of unemployment. This blog post explores how unemployment and expectations of job loss interact to affect household spending.
It’s plausible to think that people have a hunch about the safety of their job. They may form these expectations based on the profitability and growth of their employer, industry trends, or how they are treated by their superiors. Being able to predict a job loss can help workers weather a spell of unemployment—by saving money and looking for other jobs, for example. By the same token, workers who suffer a completely unforeseen job loss may have to make sudden, substantial changes to their lifestyle, cutting spending, adjusting their consumption patterns, and so on.
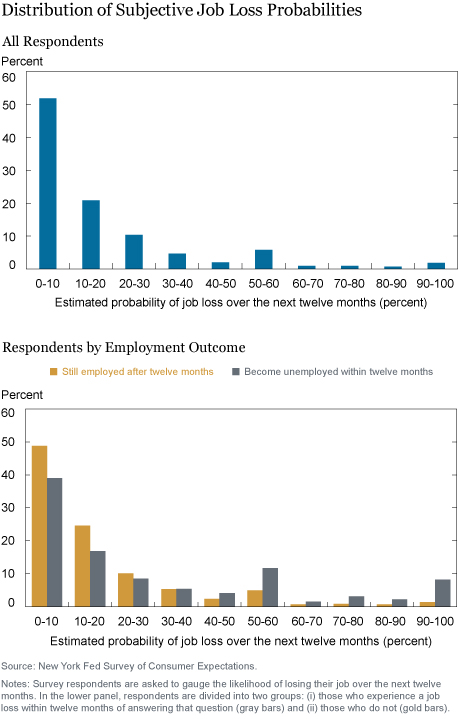
To shed some light on these issues, we analyze data from the Survey of Consumer Expectations (SCE), which asks respondents, among many other things, to gauge the likelihood of losing their job over the next twelve months. The upper panel of the chart below shows the distribution of these job loss probabilities for a sample of household heads. The majority of our sample assigns a less than 10 percent chance to experiencing job loss over the next twelve months. Around 20 percent of the sample believes their job loss risk to be between 10 and 20 percent. Interestingly, a non-negligible share of the sample (10 percent) assesses the chance of job loss at more than 50 percent, with some individuals believing with certainty that they will lose their job over the course of the next year.

How informative are these subjective expectations about the incidence of future job loss? Because the SCE allows us to link these subjective expectations to changes in labor market status, we can investigate their informational content using the longitudinal dimension of the survey. The lower panel of the same chart shows that people do have quite a bit of information about their job stability: We split the same sample into (i) those who experience a job loss within twelve months of answering the job loss expectations question (gray bars) and (ii) those who do not (gold bars). As shown by the gold and gray bars, nearly half of all workers who kept their job over the following year initially reported a job loss probability of less than 10 percent, compared to only 38 percent of those who indeed went into unemployment. Likewise, 10 percent of workers who lost their jobs in the subsequent twelve months were fairly certain of their coming separation (over 80 percent subjective job loss probability), compared to only 2 percent of those that remained employed. These findings hold up even when we control for differences in gender, age, education, race, and marital status.
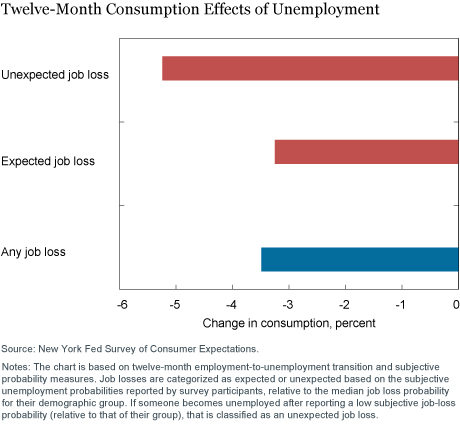
Does the ability to anticipate job loss help people cope with the consequences of such a disruption? To investigate this, we first look at how the event of a job loss affects spending. The blue bar in the chart below shows that households whose head becomes unemployed cut their spending by 3.5 percent. This decline is large—both statistically and economically. For context, in a typical recession in the United States (excluding the Great Recession), aggregate spending falls by around 1.5 percent relative to its trend.
Do anticipated job losses have a different impact on spending than unanticipated job losses? To answer this question, we first classify each job loss as anticipated or unanticipated based on the subjective probabilities reported by the respective survey participant. More specifically, we first compute an actual job loss rate for each demographic group. Then, if someone reports a subjective job loss probability that is one standard deviation above this group-specific unemployment risk, and indeed ends up becoming unemployed, we classify this event as an anticipated job loss. To the contrary, if someone reports a low subjective probability (relative to their group) and becomes unemployed, we classify this as an unanticipated job loss.

The second column shows that having some idea of the actual job loss risk helps. The decline in spending is much larger, around 5 percent, for households that were taken by surprise. Interestingly, our point estimates indicate some decline in spending for unemployed households that had anticipated job loss, though with lower statistical precision. This could point to liquidity constraints that are preventing households from smoothing consumption.
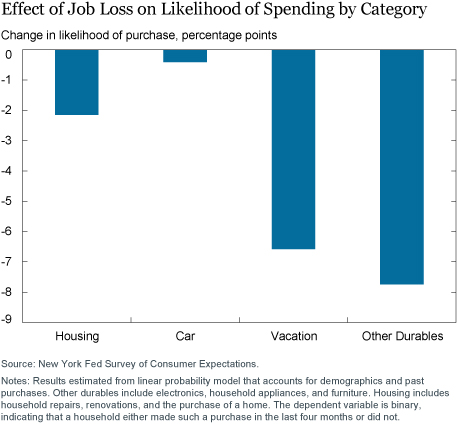
What types of spending do households prioritize and which ones do they cut when the head of the household becomes unemployed? To investigate this, we use the responses to questions about whether a household made certain types of large purchases over the previous four months containing the start of the unemployment spell. We aggregate detailed questions into four broad categories: housing-related expenditures (such as purchasing a house or spending on home improvement), car-related spending, spending on other durables (such as electronics, household appliances, and furniture), and vacation-related spending. We estimate via a linear probability model how the likelihood of spending on various categories changes when the head of household becomes unemployed, controlling for demographic characteristics as well as past large purchases of the same category. The chart below shows that the likelihood of spending on vacations and durables declines by 7 and 8 percentage points, respectively. When newly jobless individuals feel that they must decrease spending, vacations and other luxuries are the easiest items to cut. Moreover, purchases of certain nonessential household durables—a TV, a coffee table—can be delayed while individuals lack a steady income. Interestingly, we find that a transition into unemployment does not affect consumers’ decisions with respect to buying a house, making home improvements, or purchasing a car.
These findings accord with the idea that home repairs—to fix a leaky basement or faulty air conditioning—are more urgent needs and may be less responsive to income shocks induced by unemployment. Likewise, unemployed people might be unlikely to delay purchasing a car, which could be important for transportation to and from job interviews.

Disclaimer
The views expressed in this post are those of the authors and do not necessarily reflect the position of the Federal Reserve Bank of New York or the Federal Reserve System. Any errors or omissions are the responsibility of the authors.

Fatih Karahan is a senior economist in the Federal Reserve Bank of New York’s Research and Statistics Group.
 Brendan Moore is a senior research analyst in the Bank’s Research and Statistics Group.

Laura Pilossoph is an economist in the Bank’s Research and Statistics Group.
How to cite this blog post:
Fatih Karahan, Brendan Moore, and Laura Pilossoph, “Expecting the Unexpected: Job Losses and Household Spending,” Federal Reserve Bank of New York Liberty Street Economics (blog), March 27, 2019, https://libertystreeteconomics.newyorkfed.org/2019/03/expecting-the-unexpected-job-losses-and-household-spending.html.


 RSS Feed
 Follow Liberty Street Economics
Thanks for the response. My question is rather on how you can call those values as “probabilitiess”. That is why I asked which “measure theoretic space” are you working in but it seems you guys are not familiar with basic probability concepts.
Kristos: Each respondent in the SCE is asked to report a subjective probability of losing his or her job in the next twelve months, with answers necessarily bounded from 0 to 100. We then divide these reported percentages into bins. For example, per the upper panel of the first chart, just over half of the sample provided an answer in the range from 0 to 10 percent for the probability of job loss in the next twelve months. A response of precisely 10 percent is placed into the next higher bin (10-20 percent).
If you are using a term “estimated probability”, you must be working in measure theoretic probabilistic space. What space did you guys assume while making calculations?