Regional employment data provided by the U.S. Bureau of Labor Statistics (BLS) are a critically important tool used to track and assess local economic conditions on a timely basis. However, the primary data used for this purpose are monthly survey-based estimates that are revised once per year, and these revisions can sometimes be substantial and surprising. As a result, initial readings of these data can lead to conclusions about employment trends that may later change. It is possible to anticipate these revisions in advance of their release using a second publicly available data set released by the BLS. Like some of our colleagues at other Reserve Banks (the Dallas Fed and St. Louis Fed, in particular), the Federal Reserve Bank of New York is now performing an “early benchmark” of initial monthly employment releases throughout the year and making these benchmarked data available to the public on a monthly basis. Our early benchmarked estimates tend to more closely track revised data than the initial releases do, and can help policymakers and the public better monitor regional economic conditions on a timely basis.
The Early Benchmarking Procedure
Our early benchmarking process is similar to that outlined by the Dallas Fed. The BLS produces two data sets that measure regional employment levels: the Current Employment Statistics (CES) and the Quarterly Census of Employment and Wages (QCEW). The CES is the more widely used and timelier data, as it is released with a one‑month lag; but it is not comprehensive, because it is initially based only on a sample of one-third of employers. The QCEW is more comprehensive, as it is based on official unemployment insurance records, yielding a more full and accurate count of jobs. However, the QCEW is released with a six-month lag. Once per year in March, the BLS benchmarks the CES, primarily using information from the QCEW. To anticipate these revisions, the New York Fed uses quarterly releases of the QCEW to early benchmark the CES employment data at more frequent intervals, combining the timeliness of the CES data with the accuracy of the QCEW data.
We perform an early benchmark on total employment for each of the geographies in the Federal Reserve’s Second District (the region overseen by the New York Fed), from the state level down to metropolitan areas; we do not make industry-level data available. Our early benchmark estimates are available each month except for March through May, since during that time the BLS will just have released the official benchmark revisions and no new QCEW data will be available beyond what is used for this benchmark. As the year progresses beyond March, inaccuracies in the CES data can compound. Therefore it’s possible for large discrepancies to grow between the CES preliminary estimates and the revised data.
Early Benchmarked Data Can Head Off Surprises
Our early benchmarking procedure tended to perform quite well last year, leading to a more accurate tracking (compared with the initial BLS reads) of employment paths for the vast majority of geographies in our District. To illustrate, we take a look back at some examples of what our early benchmarked data indicated in 2018 before the revisions were released in March of this year. In our examples, we show (1) the preliminary data that were available at the time; (2) our early benchmarked estimates, which by the beginning of 2019 used three additional quarters of QCEW data beyond what was used for the initial benchmark; and (3) the official revised data, which wasn’t known at the time we performed our early benchmark.
Early Benchmark Estimates Typically Foretell Later Revisions
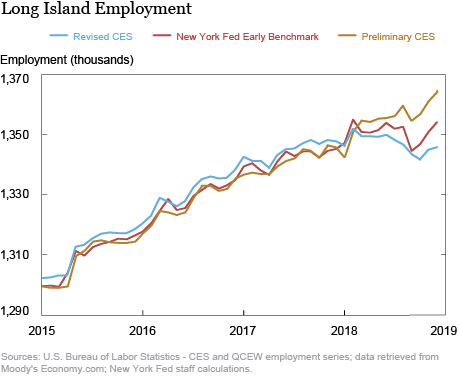
For the Long Island metropolitan area, job growth was looking much stronger than it ultimately turned out to be once the data were revised, as shown below. The gold line represents the unrevised CES, the red line is our early benchmark, and the blue line represents what was later revealed to be the official benchmark revision. For 2018, unrevised data were showing job growth of about 1.4 percent. Our early benchmark led us to expect an increase half this magnitude, at 0.7 percent. Ultimately, once the revisions were released, the area was found to have seen an employment decline of 0.1 percent for the year. In most cases, our early benchmarking procedure yields figures that are closer to the officially revised data than the initial unrevised data were.

Puerto Rico Saw More Jobs Return after Maria Than Initially Estimated
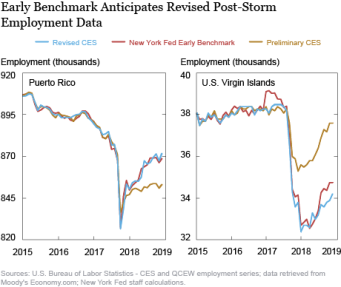
Both Puerto Rico and the U.S. Virgin Islands are part of the Second District, and monitoring economic conditions for these island economies is an important part of the New York Fed’s work. It was particularly important to assess how both economies were doing after storms ravaged the islands in late 2017. It turns out that our early benchmarking procedure was able to identify important trends that were not apparent until much later when the official revisions were released.

For Puerto Rico, initially it seemed as if the island had lost roughly 40,000 jobs after Maria, and had gained back half of these losses by the end of 2018. However, our early benchmarked data alerted us that the island was recovering much more strongly than those initial figures suggested. Our early benchmark indicated that by December 2018, employment had recovered to a level close to its pre-storm level. All in all, our benchmark was nearly identical to the official benchmark released later.
For the U.S. Virgin Islands, our early benchmark alerted us to a much more substantial job loss than was initially reported. The unrevised data indicated that around 2,700 jobs were lost shortly after the storms, a decline of about 7 percent. Our early benchmark showed a much larger loss of about 5,700 jobs, or a decline of roughly 15 percent, nearly identical to the decline reported after revisions were released. Subsequently, it appeared from the initial data releases that employment had nearly recovered to its pre-storm level by the end of 2018. However, our early benchmark pointed to a gap of over 3,500 jobs, which also turned out to be very close to the official benchmark. All in all, our estimates for both Puerto Rico and the U.S. Virgin Islands proved to be quite close to the officially revised data that were released many months later.
Visit Our Regional Website
We will post early benchmarked data on our regional website every month, except when the official benchmark is available. The regional website will also provide charts comparing our early benchmark with the preliminary data, so that readers can see any divergence. Beyond the benchmarked employment data, our website delivers a range of information and analysis on the region, including economic reports for local areas in our District. These short reports offer an overview of economic trends in each location that will be updated regularly as new data are released, including charts that show employment trends using our early benchmarked data.
 Richard Deitz is an assistant vice president in the Bank’s Research and Statistics Group.
 Jonathan Hastings is a research associate in the Bank’s Research and Statistics Group.
How to cite this post:
Richard Deitz and Jonathan Hastings, “Just Released: New Regional Employment Data Now Available,” Federal Reserve Bank of New York Liberty Street Economics, June 24, 2019, https://libertystreeteconomics.newyorkfed.org/2019/06/just-released-new-regional-employment-data-now-available.html.
Disclaimer
The views expressed in this post are those of the authors and do not necessarily reflect the position of the Federal Reserve Bank of New York or the Federal Reserve System. Any errors or omissions are the responsibility of the author.


 RSS Feed
 Follow Liberty Street Economics