In an earlier post, we studied how educational attainment affects labor market outcomes and earnings inequality. In this post, we investigate whether these labor market effects were preserved across the last business cycle: Did students with certain types of educational attainment weather the recession better?
Focusing on students’ labor market outcomes during 2003-14 (a period that spans both a boom and a bust), we hope to answer the following questions:
- Did certain majors yield better outcomes than others during the bust? Did graduation status matter more or less during the bust?
- Did students from certain types of institutions weather the recession better?
- Were disparities in earnings between majors exacerbated during the bust? Did certain majors and colleges hinder/promote economic mobility more in the bust?
To answer these questions, we use a data set, obtained from the U.S. Department of Education, that matches earnings and employment data of college cohorts with corresponding college-cohort characteristics, college characteristics, and enrollment. We analyze labor market outcomes—earnings and employment status—for 1997-2007 fall freshman college-entry cohorts six years after enrollment (2003-14). We measure college selectivity using Barron’s Profiles of American Colleges (2001), which ranks colleges based on their acceptance rates, students’ median entrance exam scores (on the SAT and ACT), the grade point averages of their freshman classes, and the percentage of freshman ranking in the top of their high school graduating classes. For simplicity, we classify four-year colleges in the top three of Barron’s six tiers as “selective” and the rest as “non-selective.”
Students who entered college in the period 1997-2007 experienced a wide range of labor market conditions as they exited college. We define the “Boom” and “Bust” periods as 2003-08 and 2009-14, respectively. This may seem slightly counterintuitive, since the economy went into recession in December 2007—still within our Boom period. However, our analysis focuses on those who entered four-year programs, and we only consider their outcomes six years after entry to allow for late exits from college and a post-college job-seeking period. Most students whose labor market outcomes we first examine in 2008 were actually in the job market before the recession began, so we modify our definition of the Bust to lag the recession.
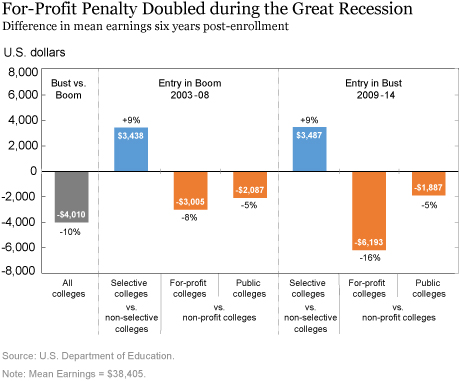
After controlling for a range of geographic and demographic factors, we analyze whether choices about type of college, type of major, and program completion have stable effects on labor market outcomes, inequality, and economic mobility across different phases of the business cycle. Labor market outcomes comprise employment and earnings, as reported in the tax data in W-2 forms and Schedule SE. We divide majors into four fields, looking at the percentage of each cohort in arts and humanities (shortened to “Arts”), business, STEM (science, technology, engineering, and math), and vocational training. We control for the invariant characteristics of counties and cohorts, as well as the time-variant characteristics of cohorts (size, racial composition, gender composition, family income, and parental education).We can see in the chart below that students who entered the labor market during the bust faced a perceptible decline in earnings. Specifically, a student entering the labor market in the Bust could expect to earn 10 percent less than her counterpart in the Boom. Furthermore, a for-profit enrollee entering the labor market in the Bust could expect to face twice the earnings penalty (relative to a non-profit enrollee) than what she would face if she entered the labor market in the Boom. In contrast, earnings of public college enrollees (relative to those of private non-profit college enrollees) remain stable across the business cycle, indicating that public college enrollees were better equipped to thrive in the weak labor market that followed the Great Recession. Similarly, the premium for attending a selective college stays the same across phases of the business cycle.

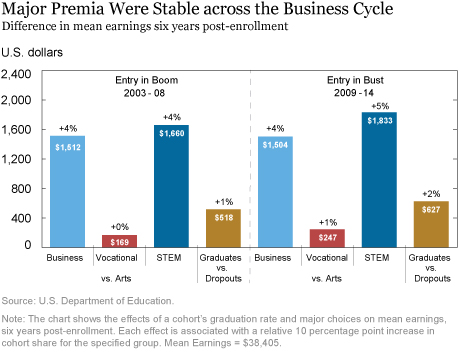
Next, we examine whether the earnings effects of graduating and choosing different majors fluctuates across the business cycle. The chart below depicts the percentage change in mean earnings of a college cohort if the share of a certain major in that cohort goes up by 10 percentage points (relative to the share of Arts majors). To understand the effect of degree completion, we analyze the change in mean earnings of a college cohort if the share of graduates in that cohort goes up by 10 percentage points. Business and STEM majors enjoy a large earnings premium over other fields, and this earnings premium is maintained (or increases marginally for STEM) in the Bust. If the share of STEM majors in a cohort increases by 10 percentage points (relative to Arts majors), the cohort enjoys 4 percent higher earnings when labor market entry is in the Boom period, and 5 percent higher earnings when labor market entry is in the Bust period. No other major enjoys as much immunity to the business cycle. Turning to the importance of degree completion, our results show a higher premium to graduation (relative to dropping out) regardless of the phase of the business cycle, and the earnings gap between graduates and dropouts remains stable for cohorts that enter the labor market in the Bust.

In results not pictured, we also examine employment rates across the same categories. Labor market entry during the Bust leads to a 4 percent decline in employment probability, but we see striking variations across college type and major choice. For-profit enrollees face a larger employment penalty relative to their non-profit counterparts in the Bust. Interestingly, though, the differences in employment rate across the business cycle are less than for earnings for each of the different education types. The relatively modest employment effects highlight the importance of majors and college type as determinants of job quality for students graduating during the Bust. While students with weaker credentials may still manage to find a job in a weak economy, they are more likely to end up in lower quality jobs that pay less.
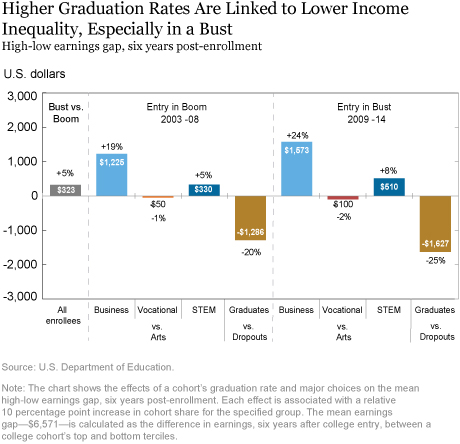
Next, we consider economic mobility and earnings inequality. Following prior work, we define economic mobility as the extent to which an individual moves up or down the earnings distribution over time. We define earnings inequality, or the earnings gap, as the difference in earnings between a college cohort’s top and bottom pre-collegiate family income terciles six years after college entry. A smaller earnings gap not only indicates a more equal earnings distribution but also points to relative upward mobility for the bottom tercile, compared to the top tercile, along the earnings scale. Our chart below presents differences in mean earnings six years after enrollment between students in the top and bottom terciles of pre-collegiate family income at time of enrollment in a four-year institution.
The average earnings gap (six years after enrollment) between enrollees in the top and bottom terciles in our sample was $6,571. The chart below shows that the 2007-09 recession widened earnings inequality, with a 5 percent higher gap for cohorts entering the labor market in the Bust relative to that for cohorts entering in the Boom. We find that degrees in Business and STEM (while more remunerative) are less equalizing—particularly for labor market entry in the Bust. A 10 percentage point increase in Business and STEM majors relative to Arts exacerbates the gap by $1,225 (19 percent) and $330 (5 percent), respectively, in the Boom versus $1,573 (24 percent) and $510 (8 percent) in the Bust. Vocational majors, in contrast, are equalizing, and slightly more so in the Bust. Graduation is a strong equalizer, even more so in the Bust. A 10 percentage point increase in graduates in a cohort decreases the earnings gap by $1,286 (20 percent) for cohorts entering the labor market in the Boom, but by $1,627 (25 percent) for those entering in the Bust. These findings imply that Vocational majors reduce inequality and also promote economic mobility, with students in the lowest tercile moving up relatively more compared to those in the highest tercile. This phenomenon is slightly larger in the Bust. In contrast STEM and Business hinder economic mobility—students in the lowest tercile move up relatively less on the earnings scale than those in the highest tercile—and this phenomenon is even more prominent in the Bust.

In additional results (not charted), we find that for-profit colleges increase inequality and impede economic mobility, even more so in the Bust. In contrast, public colleges are equalizing and promote economic mobility, more so in the Bust. These findings are especially relevant as for-profit colleges overwhelmingly cater to low income students and their enrollment share markedly increased in the last decade and a half.
Studying labor market entry during the latest boom-bust cycle, this post finds that returns to educational attainment depend critically on whether a student entered the labor market in the Boom period or the Bust. Importantly, the labor market penalties from recession vary by college type. For example, while for-profit students face an earnings penalty relative to their peers in public and non-profit colleges, regardless of the phase of the cycle, their earnings shrunk markedly more than that of their peers when the economy soured, and they struggled more to find employment. Turning to earnings inequality, we find that a weak economy widens earnings disparities, but there is remarkable variation in the extent of this widening by educational attainment. For-profit enrollment expands the earnings gap even more in the Bust, while public colleges act as equalizers and promote economic mobility, more so in the Bust. These findings highlight the important role of information in students’ decisions about college, major, and whether to persist or drop out of college. These decisions matter more in a weak economy, producing lasting impacts on labor market outcomes, inequality, and economic mobility.
 Rajashri Chakrabarti is a senior economist in the Federal Reserve Bank of New York’s Research and Statistics Group.
Michelle Jiang, a former research analyst in the Bank’s Research and Statistics Group, is a Ph.D. student at Columbia University.
 William Nober is a senior research analyst in the Bank’s Research and Statistics Group.
How to cite this post:
Rajashri Chakrabarti, Michelle Jiang, and William Nober, “Did the Value of a College Degree Decline during the Great Recession?,” Federal Reserve Bank of New York Liberty Street Economics, July 10, 2019, https://libertystreeteconomics.newyorkfed.org/2019/07/did-the-value-of-a-college-degree-decline-during-the-great-recession.html.
Disclaimer
The views expressed in this post are those of the authors and do not necessarily reflect the position of the Federal Reserve Bank of New York or the Federal Reserve System. Any errors or omissions are the responsibility of the authors.


 RSS Feed
 Follow Liberty Street Economics
Thank you for your comments. In regard to David Fawer’s comment, our analysis includes all four-year colleges that received federal Title IV funding (NCES, U.S. Department of Education, IPEDS — https://nces.ed.gov/ipeds/). To understand heterogeneous effects by selectivity of college attended, we match this dataset with Barron’s rankings and classify colleges in the top three Barron’s tiers as “selective” and rest of the colleges, including those not in Barron’s, as non-selective. The results reported in the blog post indeed show interesting differences by college selectivity. In general considering all Title IV four-year colleges, we study different cuts in the data by college type to understand whether labor market outcomes differed between students from different types of colleges and between boom and bust (after controlling for several time invariant characteristics and a rich set of observable characteristics). In regard to Phil’s comment, we have released previous posts that look at student debt ( https://libertystreeteconomics.newyorkfed.org/2016/09/the-changing-role-of-the-community-college-and-for-profit-college-borrowers.html )and default ( https://libertystreeteconomics.newyorkfed.org/2017/11/who-is-more-likely-to-default-on-student-loans.html ) of students by college type. The last chart and the corresponding discussion in the latter blog looks at the role of family background in student loan default. In a related blog post ( https://libertystreeteconomics.newyorkfed.org/2017/11/are-student-loan-defaults-cyclical-it-depends.html ), we found that default dynamics vary by the phase of the business cycle (as revealed through analysis of the Great Recession period and the boom that preceded it) and college type matters critically here too. In regard to Ian Wilder’s comment, this is a good question but our current datasets do not allow us to convincingly answer this question. The data used in the post allow us to see debt originations but not debt repayments. We have another dataset that allows us to identify debt payments but not earnings. While this latter dataset does not include comprehensive earnings data, it does help us to get at another measure of well-being, homeownership. You may be interested in a previous blog post ( https://libertystreeteconomics.newyorkfed.org/2017/04/diplomas-to-doorsteps-education-student-debt-and-homeownership.html ) on student debt and homeownership that casts some light to your question.
It’s nice to finally have data to prove that the rich kids were the ones that got all the jobs during the recession. Have you looked into the level of debt at graduation and how that affects inequality? I’d be willing to bet the high earners didn’t have much debt because their parents paid for college and had connections to get them jobs while the people who graduated with lots of debt got nowhere. Of course you’d have to factor in the increased suicide rate for those with debt they can’t pay: https://onlinelibrary.wiley.com/doi/10.1111/soin.12278
Hello, I was wondering what the net income effect was of various college choices, i.e. what is the realtive income after adjusting for student debt payments and delayed entry into the work force?
This is really good work
Your research on higher education / student debt is invaluable – thank you! I would note in regards to this piece, however, that you are using an arbitrarily reduced sample set of the total population of 4-year colleges/universities by restricting your sample set to the Barrons list. I estimate that your sample size would increase by ~50% if you used a complete set. If you are concerned with categorizing them as competitive / non-competitive you can make an appropriate assumption that they are not competitive. This is a significant issue because narrowing the scope to the Barrons schools overweights the most competitive non-profit (public and private) schools and underweights the significance of a huge set of non-competitive not-for-profit schools. As you know, enrollment in for-profit schools is less than 10% of the population, albeit with an outsized representation of defaults. I believe that it is critical to appropriately measure the complete landscape of 4-year schools in order to put the data in the proper perspective. Thank you again for your work in this area.