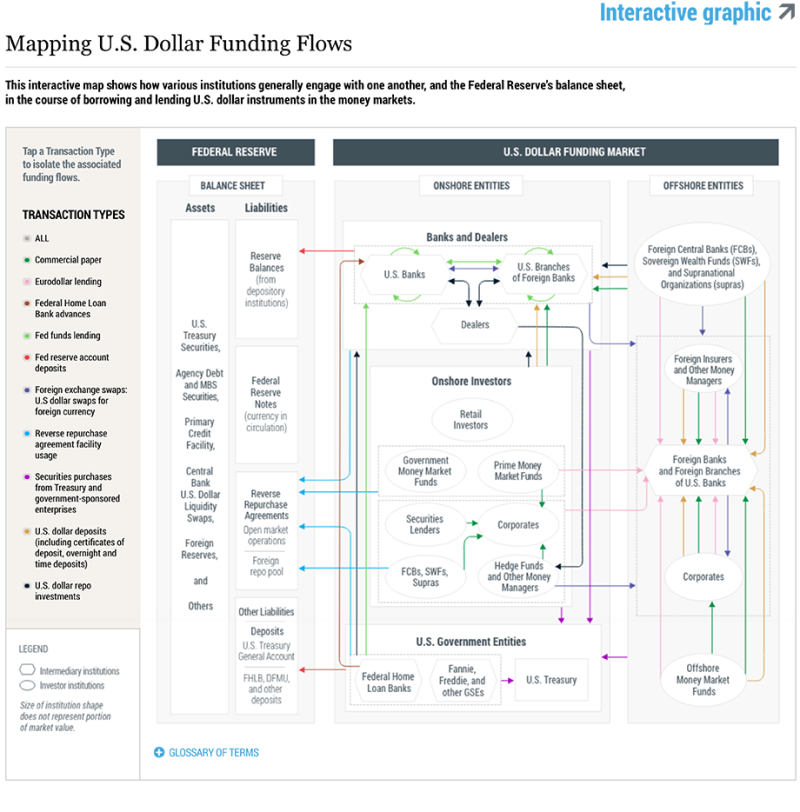
How do changes in the rate that the Federal Reserve pays on reserves held by depository institutions affect rates in money markets in which the Fed does not participate? Through which channels do changes in the so-called administered rates reach rates in onshore and offshore U.S. dollar money markets? In this post, we answer these questions with the help of an interactive map that guides us through the web of interconnected relationships between the Fed, key market players, and the various instruments in the U.S. dollar funding market, highlighting the linkages across the short-term financial products that form this market.
The Fed
In today’s monetary policy framework of ample reserves, the Fed sets two rates to steer short-term interest rates in accordance with its policy target, the fed funds target range: the interest rate paid on reserves that depository institutions hold overnight at the Federal Reserve (IOR), and the rate offered to a wide range of lenders at the overnight reverse repurchase agreement facility (ON RRP). IOR is the primary tool used to influence overnight rates in the banking system, while ON RRP acts as a supplement to IOR. As discussed in the recently published report Open Market Operations during 2018, these two “administered” rates have proven effective at ensuring interest rate control, namely by maintaining the effective federal funds rate (EFFR) within the Federal Open Market Committee’s (FOMC) target range and by steering short-term interest rates so that the stance of policy is transmitted into broader financial markets.
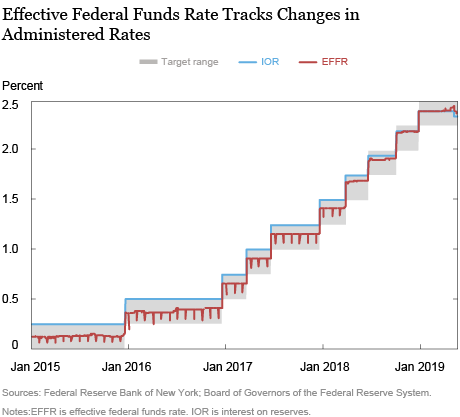
The Fed has increased its target range and the two administered rates nine times since lift-off began in December 2015. Each time it raised the administered rates, the EFFR followed closely, as shown in the chart below.

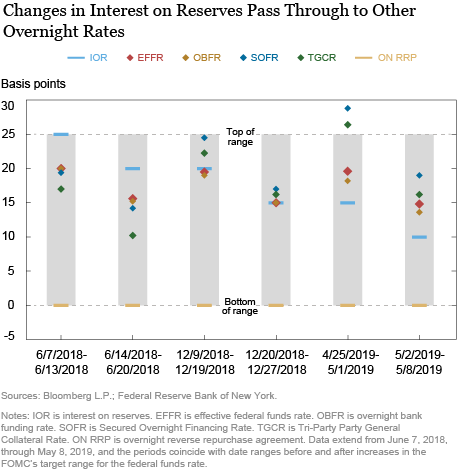
Starting in early 2018, the bulk of federal funds began trading at higher rates relative to the top of the target range, though still within the range. With this evolving money market dynamic in mind, and to provide greater assurance that overnight interest rates would remain within the target range, the Fed included in two of the nine rate hikes a technical adjustment where the IOR rate—a magnet for other money market rates—was set just below the top of the target range rather than exactly at the top of it, setting a spread between the two rates. At the May 2019 FOMC meeting, the Fed made an additional technical adjustment, cutting the IOR rate while keeping the policy target range unchanged.
The technical adjustments had the intended effect on money market conditions, as shown in the chart below. Following the introduction of a spread of 5 basis points in June 2018, later widened to 10 basis points in December, the EFFR fell by 5 basis points relative to the top of the target range (see this speech by Simon Potter regarding the June adjustment). Similarly, following a 5 basis point cut in the IOR in May 2019, the EFFR decreased by around 5 basis points. We can also see from the chart that other overnight money market rates changed by similar amounts, even though these other rates are not directly controlled by the Fed. How did that happen?

How Do Changes in Policy Rates Transmit to Other Money Markets?
To answer our question, we need to look closely at the linkages between transactions in the fed funds market and in other money markets, and grasp the broader flows within the U.S. dollar funding market. Using our interactive map as a compass, we select the transaction type “Fed reserve account deposits” to explore the effect of a change in IOR on depository institutions within the onshore wholesale U.S. dollar money market. Noting that the top red arrow reflects the flow of deposits from domestic banks and foreign banking organizations into a Fed liability (“Reserve Balances”), we show how a change in IOR directly influences the rate at which these depository institutions are willing to engage in “Fed funds lending” (light green arrows).

Next, we click on “U.S. dollar repo investments” to illustrate how depository institutions and dealers rely on borrowing cash against securities via repos (black arrows) to finance net securities inventories, creating a linkage between rates in the fed funds market and those in secured short-term money markets. To demonstrate another factor influencing repo transactions, we select “Reverse repurchase agreement facility usage,” which shows how a change in the ON RRP rate reaches a broader set of onshore institutions, including those not eligible to earn interest on reserves, such as the government-sponsored enterprises (GSEs) and money market funds (light blue arrows). Overnight lending to depository institutions comes from a variety of players, such as prime money market funds and corporations, which also invest in term transactions; we can see this by selecting “commercial paper” (dark green arrow) and “U.S. dollar deposits” (yellow arrow).
Other linkages demonstrated by the interactive map include “Securities purchases from Treasury and government-sponsored enterprises” (purple arrows) and “Federal Home Loan Bank advances” (brown arrow), further illustrating the interconnectedness between administered rates and trading in the onshore U.S. dollar funding market.
What about the Offshore U.S. Dollar Money Market?
Another important piece of the puzzle is the offshore U.S. dollar money market, given the key role that the U.S. dollar plays in global trade and finance. Similar to domestic entities, participants located abroad also own U.S. dollar businesses and need U.S. dollar funding. Therefore, an offshore U.S. dollar money market exists and incorporates, among other participants, foreign banks and foreign branches of U.S. banks. By selecting “Eurodollar lending,” we see that these banks may offer deposits (pink arrows) to attract U.S. dollar investments from onshore corporates, money market funds, and hedge funds, and from offshore investors including offshore money market funds, insurers, and corporations. Foreign banks and foreign branches of U.S. banks may also offer commercial paper to a similar group of onshore and offshore entities, further linking the onshore and offshore U.S. dollar funding markets.
An additional linkage comes through “Foreign exchange swaps.” Some offshore entities may use foreign exchange swaps to meet their U.S. dollar funding needs by temporarily swapping their foreign currency balances into U.S. dollars (dark blue arrows), and also to hedge their U.S. dollar exposures. U.S. dollar lending in foreign exchange swaps can come from both offshore and onshore entities.
And so to answer our original question, changes in administered rates reach markets where the Fed does not intervene through the web of interconnected relationships between both onshore and offshore participants and through a host of short-term financial products. These interlinkages and connections are the basis for the efficient pass-through of monetary policy.

Gara Afonso is an assistant vice president in the Federal Reserve Bank of New York’s Research and Statistics Group.

Fabiola Ravazzolo is an officer in the Bank’s Markets Group.

Alessandro Zori is a senior associate in the Bank’s Markets Group.
How to cite this post:
Gara Afonso, Fabiola Ravazzolo, and Alessandro Zori, “From Policy Rates to Market Rates—Untangling the U.S. Dollar Funding Market,” Federal Reserve Bank of New York Liberty Street Economics, July 8, 2019, https://libertystreeteconomics.newyorkfed.org/2019/07/from-policy-rates-to-market-ratesuntangling-the-us-dollar-funding-market.html.
Disclaimer
The views expressed in this post are those of the authors and do not necessarily reflect the position of the Federal Reserve Bank of New York or the Federal Reserve System. Any errors or omissions are the responsibility of the authors.


 RSS Feed
 Follow Liberty Street Economics
Stefan: Thank you for your comment and for reading our blog. The effective fed funds rate can print below interest on reserves (IOR) because government-sponsored enterprises (GSEs) are eligible to lend funds in the federal funds market, but are not eligible to earn IOR.
Wojciech: Thank you for your questions and for your interest in our work. Interest on reserves (IOR) has not served as a hard minimum rate at which all institutions are willing to lend funds because some institutions are eligible to lend funds in the federal funds market but are not eligible to earn IOR, such as the government-sponsored enterprises (GSEs). Clicking on “fed funds lending” in our interactive map shows that lending in this market could be done by two types of entities: banks and GSEs such as Federal Home Loan Banks (see https://libertystreeteconomics.newyorkfed.org/2013/12/whos-lending-in-the-fed-funds-market.html for details). The rates at which these entities are willing to lend are different because banks are eligible to earn IOR while GSEs are not. In an environment with abundant reserves, banks might have an incentive to borrow at rates below IOR from an entity that does not earn IOR to then hold the funds in their reserve account and earn IOR on those funds. This would reflect arbitrage activity rather than a real funding need and could lead the effective fed funds rate (EFFR) to print below IOR (see https://www.federalreserve.gov/econresdata/feds/2015/files/2015047pap.pdf for additional detail). In addition to IOR eligibility, other factors including the impact on their balance sheet influence the rates some banks are willing to pay for fed funds, which may limit on the rate a bank is willing to pay.
I fully agree with your comment. It clarified exactly what I was thinking, specifically that the IOR should be a floor for the EFFR. What puzzles me is that historically this has not been the case until recently as shown in the first chart of this post. Until the end of 2018 the EFFR was clearly below the IOR. Hence the question what historically led US banks to lend money unsecured at the EFFR rate when they could have left the deposits at the Fed with the higher IOR rate? Any insight on this would be greatly appreciated.
Thanks for this great explanation and interactive map. I never fully grasped why the Effective Fed Funds Rate (which in my understanding would correspond to Fed funds lending in the interactive map?) has been below the IOR. What sense does it make for an institution to lend money unsecured at a rate (EFFR) which is lower than the rate for riskless lending to the Fed (IOR)? Especially as according to the interactive map, all institutions that have access to Fed funds lending also have access to Fed reserve account deposits?
Please explain how does the IOR cap the EFFR if it is a deposit (not a lending) rate? I would understand that it is a floor on the rates – not a cap. If it IOR was a lending rate i.e the rate at which the Federal Reserve supplied liquidity into the market then it would make sense: the EFFR would never go above the IOR, because any bank would always be able to get cash at te IOR rate from the Federal Reserve. However, the IOR seems to be generally above the EFFR, why? Shouldn’t banks be borrowing money at the EFFR rate and investing it at the IOR rate earning a risk ree profit? The EFFR would move closer to the IOR rate in such a case. What am I missing here?