Chinese residents are increasingly traveling to see the rest of the world, logging a total of 162 million foreign visits in 2018, up from 57 million in 2010. Increased travel spending by Chinese residents is acting to reduce the country’s trade surplus because such spending is counted as a services import. However, there appears to be a quirk in the Chinese data that results in a significant understatement of the offsetting spending by visitors to China (a services export). According to other Chinese data, this understatement totaled $85 billion in 2018. If so, China’s deficit in travel services is smaller than officially reported, and its trade surplus correspondingly larger.
Trade and Travel
China’s merchandise trade surplus totaled almost $400 billion last year, which is near its average for the past decade. China’s services trade balance, however, was in deficit to the tune of nearly $300 billion, well above the average for the past ten years. The large deterioration in the services trade balance is largely due to its travel component.
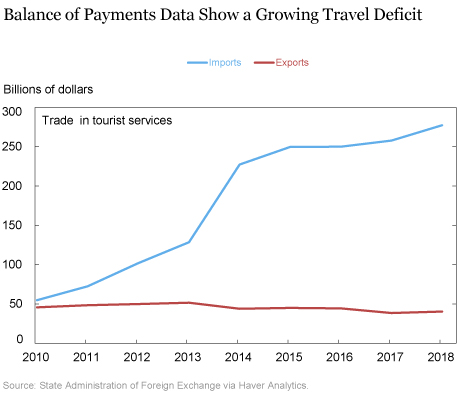
In the balance of payments accounts, spending by foreign visitors is counted as a services export, while spending by domestic residents traveling abroad is counted as a services import. The chart below shows spending by visitors to and from China since 2010. The two trends diverge dramatically—so much so that the large current travel services deficit might appear implausible. Did travel services imports really quintuple over eight years even as travel exports remained unchanged? Let’s consider imports and exports separately.

Imports: China Sees the World
On the import side, the Chinese data have seen important recent revisions. Beginning in 2015, the statistical authorities began using information from credit and debit card transactions to improve estimates of money being spent abroad. The revisions to the data, however, went back only to 2014, with foreign spending for that year initially revised up by some $70 billion (more than 40 percent).
In 2017, a second round of revisions was implemented, with some spending formerly counted as travel moved to the financial account of the balance of payments. The financial account records investment transactions and this change came after widespread discussion, including among Chinese officials, that tourist spending was being used to hide capital flight. We cannot be certain, however, that this was the sole or even the main reason for this round of revisions. (That said, the size of these downward revisions are in line with some industry analysts’ estimates of disguised outflows in the tourism account.) The subsequent revisions lowered reported travel spending in 2015 and 2016 significantly. Taken together, the two rounds of revisions raised the level of travel spending. In the chart above, if we apply the revisions for 2014 proportionally to earlier years, travel spending would begin at around $75 billion in 2010, and the growth through 2014 would appear much smoother.
Even so, growth in travel by Chinese residents has been quite rapid, with the number of outbound trips nearly tripling since 2010. The growth in travel seems less surprising when we consider the rapid growth of China’s economy. Per capita income has more than doubled since 2010, from $4,500 that year to $9,600 in 2018. China’s rapid urbanization has also been a supporting factor, since city-dwellers are more likely to travel abroad. China’s urban population rose by 20 percent (162 million) from 2010 to 2018, even as the total population increased by just 4 percent (55 million).
Rapid income growth also helps make sense of the trend in spending per foreign trip. Given our adjusted estimates for pre-2014 travel imports, spending per trip increased from $1,300 in 2010 to $1,700 last year—not so large given the more than doubling of per capita income. (The calculation using previously reported data would show spending per trip rising from $950 to $1,700, a proportional increase that would still lag behind per capita income growth.)
Does the current level of travel services imports appear reasonable? A recent study found that China’s travel imports are close to the predicted value given economic, geographic, and other fundamentals. Average spending per Chinese traveler is also in line with model predictions. One fact helps summarize these findings. In 2018, China ranked 42nd out of 111 countries in travel spending per capita—and 41st out of 111 countries in U.S. dollar GDP per capita. As it is, China’s large population and economy make its total travel imports the largest in the world.
Exports: Measurement Questions
The Chinese travel export data were revised in 2015, together with the revision to imports, apparently to also take in information from credit and debit card transactions. These revisions almost doubled reported exports for 2014 (from $57 billion to $105 billion), and boosted initially-reported values for 2015 and 2016 to $114 billion and $120 billion, respectively. But a second round of revisions in 2017 more than reversed this upward adjustment, with travel exports now reported at about $45 billion for those years. To our knowledge, the statistical authorities have not released an explanation for this change. Reported travel exports have fallen further since then, coming in at $40 billion last year.
It makes sense that foreign travel spending in China would grow more slowly than outbound travel spending. The global population outside China has grown by only 11 percent since 2010, and per capita income outside China has risen just 7 percent in U.S. dollar terms. Consistent with these trends, data from the Ministry of Culture and Tourism show 141 million inbound trips last year, up a modest 7 million (5½ percent) from 2010 to 2018. But that travel exports would see a decline since 2010 is surprising, particularly given domestic inflation and the depreciation of the dollar against China’s currency, which makes visiting China more expensive. The consumer price index, measured in dollar terms, rose 45 percent from 2010 to 2018.
The current level of reported travel spending in China also seems oddly low. Travel exports as a share of GDP stand at only 0.3 percent—the eighth lowest worldwide out of 111 countries, and the lowest for any country with a per capita income of above $2,500. Moreover, spending per foreign visit stands at $285, down from $340 in 2010. Granted, about half of all visits into China are daytrips—primarily by residents of Hong Kong. But spending per trip would be only $640 even if one assumed all daytrips were cost-free.
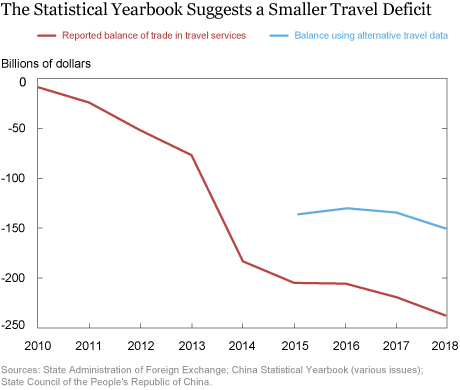
Other Chinese data suggests that travel spending in China is higher than reflected in the balance of payments accounts. A press release from China’s State Council—the country’s highest administrative authority—placed tourism receipts at $127 billion in 2018, more than three times the balance of payments figure, citing data from the Ministry of Culture and Tourism. Various editions of the China Statistical Yearbook also report higher figures for recent years. Strikingly, these figures match balance of payments data released prior to the 2017 round of downward revisions. Moreover, the included data notes describe this line item in a way consistent with balance of payments conventions.
These data put current travel exports as a share of GDP at slightly above 0.9 percent. Travel exports as a share of GDP would now stand at 18th lowest worldwide out of 111 countries, and seventh lowest among the 75 countries with per capita incomes above $2,500. In short, travel exports would still be low relative to international norms, but not to such an extreme degree. In turn, the travel deficit would be smaller than now reported, by roughly $85 billion or 0.6 percent of GDP (see chart below).

A data quirk appears to be inflating China’s travel services deficit. To be clear, this quirk would not be driving the trend deterioration in the travel services balance. As we’ve discussed, travel imports have been growing more rapidly than travel exports due to the especially rapid growth of Chinese incomes. But this data quirk would imply that China’s overall trade surplus is larger than reported, by about $85 billion in 2018, or 0.6 percent of GDP.
References
Wong, Anna, “China’s Current Account: External Rebalancing or Capital Flight,”
Board of Governors of the Federal Reserve System, International Finance Discussion Papers, Number 1208, June 2017.
 Matthew Higgins is a vice president in the Federal Reserve Bank of New York’s Research and Statistics Group.
 Thomas Klitgaard is a vice president in the Bank’s Research and Statistics Group.
Anna Wong is a senior economist at the Board of Governors of the Federal Reserve System.
How to cite this post:
Matthew Higgins, Thomas Klitgaard, and Anna Wong, “Does a Data Quirk Inflate China’s Travel Services Deficit?,” Federal Reserve Bank of New York Liberty Street Economics, August 7, 2019, https://libertystreeteconomics.newyorkfed.org/2019/08/does-a-data-quirk-inflate-chinas-travel-services-deficit.html.
Disclaimer
The views expressed in this post are those of the authors and do not necessarily reflect the position of the Federal Reserve Bank of New York or the Federal Reserve System. Any errors or omissions are the responsibility of the author.


 RSS Feed
 Follow Liberty Street Economics