How should we measure market expectations of the U.S. government failing to meet its debt obligations and thereby defaulting? A natural candidate would be to use the spreads on U.S. sovereign single-name credit default swaps (CDS): since a CDS provides insurance to the buyer for the possibility of default, an increase in the CDS spread would indicate an increase in the market-perceived probability of a credit event occurring. In this post, we argue that aggregate measures of activity in U.S. sovereign CDS mask a decrease in risk-forming transactions after 2014. That is, quoted CDS spreads in this market are based on few, if any, market transactions and thus may be a misleading indicator of market expectations.
What Might a U.S. Sovereign Default Look Like?
As with corporations, a credit event for a sovereign may take one of several forms, including “fundamental” default, with the government unable to repay its debt obligations in total, and “technical” default, with the government temporarily postponing payments on the debt. In the case of the United States, a credit event would most likely be a technical default—for example, if borrowing were to reach the debt ceiling legislated by Congress. Under such a scenario, the U.S. Treasury might be forced to postpone one or more coupon payments or security redemptions until the ceiling were suspended or increased. The U.S. sovereign CDS spread is thus more likely to reflect the probability of a technical, rather than a fundamental, default.
Aggregate Activity in the U.S. Sovereign CDS Market
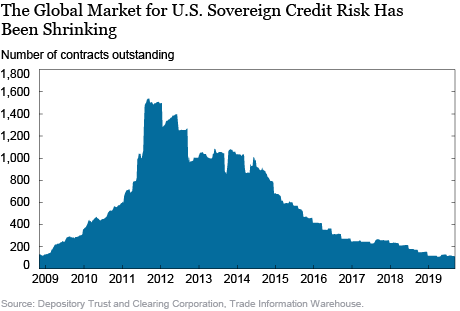
The market for U.S. sovereign credit risk has been shrinking since June 2014, as shown in the chart below, with 128 contracts outstanding as of June 11, 2019, less than one-tenth the peak of 1,538 contracts outstanding on September 16, 2011. At the same time, the gross notional value of outstanding positions in the market has also shrunk, to $3.7 billion, from its peak of $32.3 billion on August 26, 2011.

Transactions in the U.S. Sovereign CDS Market
To understand what has driven the decrease in activity in the U.S. sovereign CDS market, we use proprietary transaction-level data from the CDS trade repository maintained by the Depository Trust and Clearing Corporation to track the types of transactions in U.S. sovereign CDS over time. We focus on “risk-forming” transactions, which change market participants’ risk exposures. Risk-forming transactions can be separated into trades, which create new exposures in the financial system; terminations, which remove exposures from the financial system; and assignments, which transfer exposures among market participants.
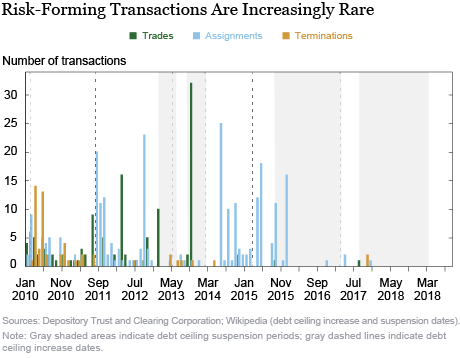
The chart below shows that, between January 2010 and June 2019, a total of 433 “risk-forming” transactions took place involving a U.S. supervised institution, with the majority of these transactions occurring prior to January 2016. Moreover, out of the 433 total transactions, only 124 are new trades, and these occur almost exclusively prior to January 2014. Starting in January 2014, the majority of transactions are instead assignments, redistributing exposure to U.S. sovereign credit risk within the financial system. Terminations are particularly rare in our sample, with the majority of the 55 terminations taking place in 2010. Thus, the overall decrease in gross notional volume outstanding that we discussed above has likely been driven by a decreased willingness of market participants to create new exposures by initiating trades. As the existing contracts mature, the gross notional volume declines commensurately.

The chart above also shows that during the 2011-2014 period, trades primarily occurred ahead of debt ceiling suspensions, with market participants speculating on whether the debt ceiling would be breached, causing the United States to enter into a technical default. However, the more recent debt ceiling suspensions and subsequent debt ceiling increases seem not to have generated the same type of trading activity.
Who Trades with Whom?
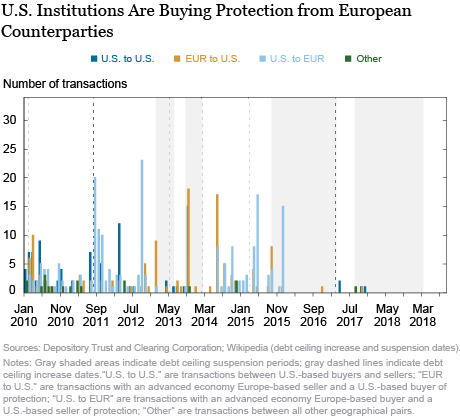
We now turn to studying which institutions were buying and selling protection in the U.S. sovereign CDS market. The chart below shows that, prior to 2015, the majority of transactions involved U.S.-based institutions buying protection from institutions based in advanced European economies. Post 2015, when the majority of transactions were assignments, U.S.-based institutions were assigning their positions to institutions based in advanced European economies. Thus, the market for U.S. sovereign credit risk involves little wrong-way risk: buyers of protection in the U.S. sovereign CDS market are not facing U.S. counterparties.

What about the Observed Spreads?
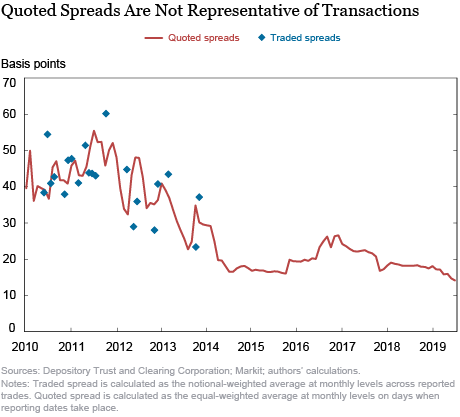
So, are the quoted U.S. sovereign CDS spreads a useful measure of market participants’ expectations of U.S. sovereign credit risk? The chart below shows that this is unlikely to be the case. First, starting in 2014, not enough trades in the benchmark five-year maturity occur to compute a traded spread on U.S. sovereign CDS: quoted CDS spreads in this market are based on few, if any, transactions. Second, even prior to 2014, the difference between the quoted and the traded spreads was frequently as large as 10 percent of the spread.

Conclusion
The spread on U.S. sovereign CDS has received increased academic scrutiny in recent years, with proposed drivers including the probability of endogenous fiscal default and compensation for inflation risk. Our post suggests that such fundamental factors are unlikely to be the source of variation in quoted spreads because the quoted spreads in recent years are backed by few to no transactions.
 Nina Boyarchenko is an officer in the Federal Reserve Bank of New York’s Research and Statistics Group.
 Or Shachar is an economist in the Bank’s Research and Statistics Group.
How to cite this post:
Nina Boyarchenko and Or Shachar, “The Evolving Market for U.S. Sovereign Credit Risk,” Federal Reserve Bank of New York Liberty Street Economics, January 6, 2020, https://libertystreeteconomics.newyorkfed.org/2020/01/the-evolving-market-for-us-sovereign-credit-risk.html.
Disclaimer
The views expressed in this post are those of the authors and do not necessarily reflect the position of the Federal Reserve Bank of New York or the Federal Reserve System. Any errors or omissions are the responsibility of the authors.


 RSS Feed
 Follow Liberty Street Economics
Having a hard time understanding the meaning of the discussion. All the measures of default risk are relative default risk. You only arrive at an absolute default probability from spreads by assuming both a risk free rate and a recovery rate. The risk free rate widely used to arrive at Sov Spreads (yield – risk free rate) is the exact interest rate you are trying to extract default probabilities from.