Editor’s note: When this post was first published, the chart labels for “Non-Boom Counties” were incorrect; the labels have been corrected. (February 26, 12:00 pm)
The role of subprime mortgage lending in the U.S. housing boom of the 2000s is hotly debated in academic literature. One prevailing
narrative ascribes the unprecedented home price growth during the mid-2000s to an expansion in mortgage lending to subprime borrowers. This post, based on our recent working paper, “Villains or Scapegoats? The Role of Subprime Borrowers in Driving the U.S. Housing Boom,” presents evidence that is inconsistent with conventional wisdom. In particular, we show that the housing boom and the subprime boom occurred in different places.
Where Were the Subprime and Housing Booms?
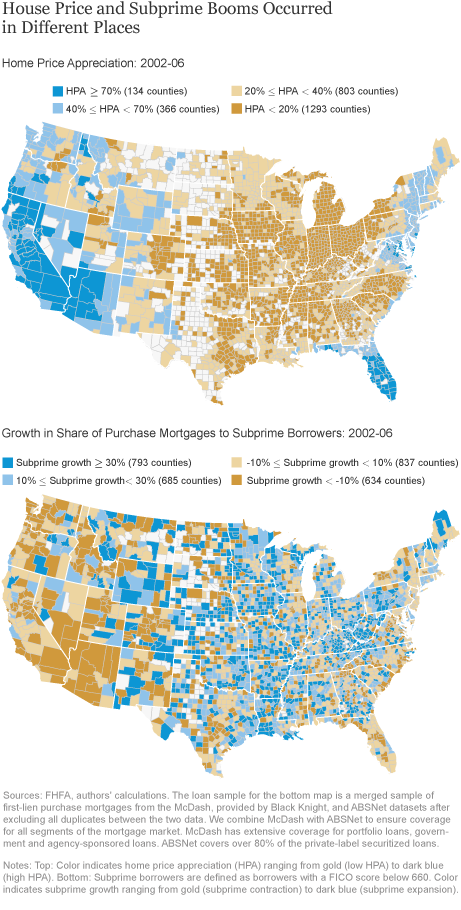
The exhibit below provides a straightforward illustration of our main finding. The top panel maps U.S. county-level house price growth between 2002 and 2006. The bottom panel plots the growth in the share of first-lien purchase mortgages to subprime borrowers over the same period. The contrast between the two panels is striking. House price growth was fastest in the western part of the country, Florida, and the Northeast Corridor, while the fastest growth in the subprime share of purchase lending occurred in areas like the Midwest and Ohio River Valley. Simply put, the housing boom and the subprime boom occurred in different places.

Multivariate regression analysis presented in the paper confirms the negative correlation between the growth in house prices and the increase in subprime share of home purchase mortgages at the county level over this period. This negative correlation is also shown to be robust to different regression specifications, time periods, house price indices, and credit score thresholds for defining subprime borrowers.
What Accounts for the Negative Correlation?
Our findings run counter to the traditional narrative of the 2000s housing boom: namely, that the growth in subprime home purchases led to the growth in house prices. One potential explanation for the negative correlation is reverse causality. That is, high house price appreciation may have made property increasingly unaffordable for subprime borrowers, leading to a “pricing out” effect. We present evidence in our paper that county-level house price growth had a negative and economically meaningful causal effect on the growth in the share of subprime purchase mortgage lending at the county level between 2002 and 2006. Moreover, using the Federal Reserve Bank of New York
Consumer Credit Panel, we find that higher house price growth lowered the relative likelihood of a subprime individual becoming a homeowner. Taken together, these findings are consistent with a pricing out effect.
Were Subprime Mortgages More Likely to be Fraudulent?
While the growth in subprime mortgage lending was not a principal driver of the U.S. house price boom in the 2000s, it may still have played an indirect role by facilitating activities that have been linked to the boom. The literature has focused on two such activities:
speculation by real estate investors; and
mortgage fraud
in the forms of appraisal inflation and income or occupancy misrepresentation. For this post we will focus on our findings related to appraisal inflation. Results related to other fraudulent lending and speculation activities can be found in the paper.
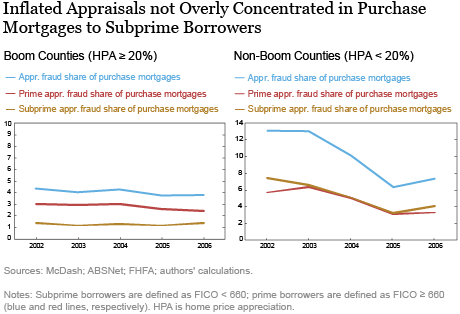
We identify appraisals as inflated if the difference between the appraised value and the estimated value at origination from Lewtan’s (ABSNet) proprietary automated valuation model (AVM) is at least 20 percent above the average of these two value estimates. The next chart plots the share of privately securitized home purchase mortgages that we identify as having inflated appraisals for boom and non-boom areas, distinguishing between those for prime and subprime borrowers. (Boom counties are defined as those with home price growth exceeding 20 percent between 2002 and 2006.)

There are two important takeaways. First, in boom areas, a significantly lower fraction of home purchase loans characterized by appraisal inflation were to subprime borrowers than to prime borrowers. Second, the incidence of appraisal inflation in home purchase mortgages does not appear to increase over time—for either subprime or prime borrowers—in either type of county. For boom counties, the overall share remains steady over time, while in non-boom areas the share decreases through the end of 2004 before picking up slightly.
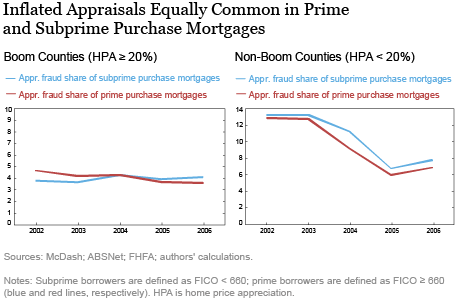
In the next chart, we delineate the purchase shares of mortgages with inflated appraisals by prime and subprime borrowers separately. In both boom and non-boom areas the shares of inflated appraisals for prime and subprime purchase loans track very closely. This finding suggests that inflated appraisals were not overly concentrated in home purchase loans to subprime borrowers.

Conclusion
Our findings run counter to the prevailing view of the U.S. housing boom in the first decade of this century. Specifically, we reveal that house price growth during this period was negatively correlated with the growth in home purchase lending to subprime borrowers. We further provide evidence consistent with this being a result of subprime borrowers being priced out of rapidly appreciating markets. We also show that seemingly fraudulent activities were not overly concentrated among subprime borrowers. Our analysis contributes to a
“new narrative”
that rapid U.S. house price appreciation during the 2000s was mainly driven by prime borrowers. Hence, policy prescriptions intended to limit access to credit for marginal borrowers may be insufficient by themselves to prevent a future housing boom.
James Conklin is an assistant professor of real estate at the University of Georgia.
W. Scott Frame is a vice president in the Research Department of the Federal Reserve Bank of Dallas.
Kristopher Gerardi is a financial economist and adviser in the Research Department of the Federal Reserve Bank of Atlanta.

Haoyang Liu is an economist in the Research and Statistics Group of the Federal Reserve Bank of New York.
How to cite this post:
James Conklin, W. Scott Frame, Kristopher Gerardi, and Haoyang Liu, “Did Subprime Borrowers Drive the Housing Boom?,” Federal Reserve Bank of New York Liberty Street Economics, February 26, 2020, https://libertystreeteconomics.newyorkfed.org/2020/02/did-subprime-borrowers-drive-the-housing-boom.html.
Disclaimer
The views expressed in this post are those of the authors and do not necessarily reflect the position of the Federal Reserve Bank of New York or the Federal Reserve System. Any errors or omissions are the responsibility of the authors.


 RSS Feed
 Follow Liberty Street Economics
Outside of the real estate industry, I think people used “subprime” to mean “not prime.” They would call a zero-down, no-doc, neg-am mortgage sold to someone with a prime credit score as a subprime mortgage. To the average person, subprime refers to the mortgage, not the borrowers’ credit score.
Ted: thank you very much for your questions. On your first question, in the associated working paper we controlled for the level of subprime lending in 2002, and the results we report in this post still hold. Also, the initial level of subprime lending is not correlated with subsequent home price appreciation. Regarding your second question, in the paper we show that the results hold at a zip-code level. We also note that most of the variation in home price appreciation in our sample period was at the county level and that the variation in home price appreciation across zip codes within counties was relatively small. Finally, thank you for your note on the footnote of the subprime map! We have updated it.
I’m curious about the use of growth in subprime lending, as opposed to the prevalence of subprime lending, as the factor for examination of correlation with home price appreciation. Areas where subprime is low prevalence could show large growth in percentage terms but still be lower prevalence relative to areas where prevalence was high to begin with. Also, I’d be interested to see if the results change when you move to a more granular geographic level. AEI has shown some important within-county differences in the level of subprime lending and its impact. Finally, the notes to your US map showing subprime growth are inconsistent with the legend.
Jared, thanks for your questions. On your first question, we did find some evidence that risky loans were decoupled from subprime borrowers. Relatedly, we also found some evidence that loans to subprime zip codes within boom counties were decoupled from subprime borrowers; that is, prime borrowers were increasingly buying in subprime zip codes within boom areas, potentially pricing out subprime borrowers. Regarding your second question, we have not looked at higher-priced loans specifically, but that could be something for future research. Finally, the growth of foreclosures was more concentrated in home price boom counties rather than in subprime boom counties.
Great article, that dispels the myth that subprime housing caused price appreciation. I’ve always been of the view that this is indeed not the case. Price appreciation in the lead up to the 2008 crisis was caused due to supply side factors than by demand appreciation. I think for various reasons, there was an acute shortage in supply and this led to appreciation. We’ve seen similar misidentification and misattribution in other parts of the world, especially France. Wasmer
Thank you. Home prices rose fastest where building was not allowed to keep pace with job growth, net migration etc. This is the primary cause of the rapid price increases, not subprime borrowing. This is very different from the places that were allowed to build sufficient housing during that period. The mistaken subprime belief has cost many people dearly. Simply look at the number of places where lower priced homes are now far cheaper to own than to rent. The only thing constraining rents was the pace of building and rent growth only cratered because of the severity of the recession. Rent growth could have been kept in check during the current expansion in not for the curtailed lending to people who can somehow afford to pay significantly more to rent than to buy but somehow can’t afford a mortgage. Further this mistaken belief has also led to tighter than optimal monetary policy, since shelter inflation has held up overall inflation during the expansion. We were experiencing a housing shortage and still are to this day. Unfortunately the other adjustments to alleviate this – slower immigration, lower birthrates take much longer to play out. Overly tight monetary policy was the primary cause of the financial crisis and severity of the housing bust, not irresponsible lending.
Good stuff! I seem to recall some previous research demonstrating that a significant portion of subprime loans (defined as higher-priced loans) actually went to prime borrowers, especially in minority communities. Does your research indicate any decoupling of subprime LOANS from subprime BORROWERS? Does it find any correlation between higher-priced loans and house price appreciation? Also, was the growth of foreclosures more highly correlated with the house price boom or subprime borrower boom?
Interesting conclusions. I think the dominant view for the proliferation of subprime mortgages is more of lowering underwriting standards, not fraud per se. The so-called NINJA (No Income, No Job or Asset) mortgages were quite common, which if underwriting standards were higher would all have been denied. In addition, subprime RMBS started becoming the main asset classes in CDOs during this period, so there was a market for these products as originators did not really care about the borrowers since they can just package the loans and transfer the risk to other parties.