Today, the New York Fed’s Center for Microeconomic Data released the Quarterly Report on Household Debt and Credit for 2020:Q1. Because consumer debt servicing statements are typically furnished to credit bureaus only once during every statement period, our snapshot of consumer credit reports as of March 31, 2020 is, in effect, largely a pre‑COVID‑19 view of the consumer balance sheet. While significant indications of the pandemic are yet to appear in our Consumer Credit Panel (CCP—the data source for the Quarterly Report, based on anonymized Equifax credit reports), we are able to observe the credit position of the American consumer just as the pandemic and associated lockdowns struck the United States.
Consumers’ credit positions are relevant to understanding the economic impact of the coronavirus for at least two reasons. First, debt service has been one channel through which households have been provided relief. The CARES Act has provisions that serve to forbear different types of household and small business debts, and the CCP allows us to size out the aggregate potential temporary relief to consumers who may choose to defer payments during this time thanks to the new policies. Second, available credit may serve as a buffer to sustain households whose income declines.
Debt Service Costs: Monthly Payments and Obligations
Loan servicers inform credit bureaus of monthly payments due from borrowers, which we report here among borrowers who have a loan in that category. Here, we take a close look at the typical monthly payments from consumers with installment loans, such as mortgages, auto loans, and student loans, on their credit reports. Mortgage and student loan payments were the key debt types for which the CARES Act created forbearances, but 55 percent of American adults aged 65 and under don’t carry these types of debt (about 29 percent have a mortgage and about 21 percent have a student loan; only about 5 percent have both). Thus, while these policies certainly provide substantial benefits to mortgage and student loan borrowers, they do not benefit all consumers. The aggregate monthly mortgage payment on the federally backed mortgages that are now eligible for mortgage forbearance (including those backed by Fannie Mae, Freddie Mac, the Federal Housing Administration, and the Department of Veterans Affairs) is approximately $55 billion per month, or $330 billion over the first six-month forbearance period (note that these payments may include property tax and other fees). For student loans, the aggregate payment due is about $7 billion per month, or about $42 billion over the six months of forbearance periods. In total, these programs may potentially provide more than $370 billion of temporary relief in cash flow to borrowers through deferred payments, which is similar to the size of the first round of the Paycheck Protection Program ($349 billion).
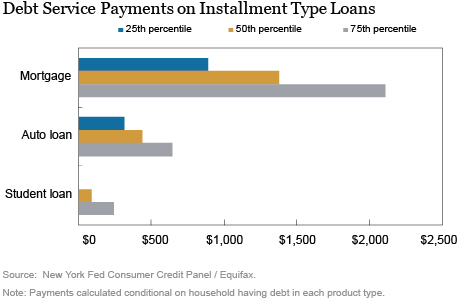
The chart below shows the distribution of monthly payments for installment loans (including mortgage, auto, and student loans). Mortgage payments are typically the largest monthly obligation among borrowers, with the median payment just under $1,500 in March 2020. Auto loan payments are in the middle, with the median auto loan payment of about $440 as of the first quarter of 2020. Many auto lenders are offering forbearance options, although these are not mandated by the CARES Act.
Student loans are somewhat more complicated, because of the in-school deferment period and the myriad repayment plans available on federal loans, which account for the vast majority of U.S. households’ $1.5 trillion outstanding student loan balance. Many student loan borrowers are already enrolled in income-driven repayment programs or other forbearances that have reduced their payments to zero. Unlike mortgage borrowers, about one-third of the 44 million Americans with student loans do not currently have a payment due on those loans; they will not benefit directly from the forbearance provisions in the CARES Act but may benefit from the zero percent interest rate in place during this period. Note that of the 15 percent of borrowers who were either delinquent or in default on their student loans just before the pandemic hit the United States, many will benefit from the zero percent interest rate and the pause on collections, including wage garnishments. Thus, the student loan payment is only $87 at the 50th percentile—and zero at the 25th percentile, which is not visible on the chart.

Available Credit
On the credit side, open revolving credit lines may provide critical borrowing opportunities to consumers to smooth gaps in income. In the Consumer Credit Panel, we first look at available credit on credit cards, the most prevalent form of consumer credit. In aggregate, there is about $3.93 trillion of total credit on credit cards and $893 billion of balances, leaving about $3.04 trillion in credit available for consumption. However, once we break out available credit by income group, we can see that it is unevenly distributed. (Note that income information is not reported on credit reports; instead we classify individuals by the average adjusted gross income in their zip code, using data from the IRS Statistics of Income.)
The prevalence of credit cards increases with zip code income: about 60 percent of people in the lowest income zip codes have credit card accounts, compared to 76 percent of individuals in higher income zip codes. But the available credit these borrowers can draw on is very different. In the chart below, we show the distribution of available credit at the individual level (credit limit on all cards minus the outstanding balance on all cards). In the lower income zip codes (those with average adjusted gross income under $45,000, measured in 2016), the median is just about $1,900; this grows, steadily, with income, and in the highest income areas, the median credit card holder has nearly $14,000 to draw on. By contrast, at the 25th percentile, the available credit is far lower, suggesting that in lower income zip codes, a large share of credit card borrowers will not be able to lean on their credit cards. In the lowest income zip codes, 25 percent of borrowers have at most $150 to draw on, and in the next group up, that number increases only to $370. Of course, this does not capture the full picture of the credit situation of borrowers since, for example, people with very little credit of their own may be able to depend on other household members’ available credit. Nonetheless, this is an interesting gauge of the credit cushion that people can rely on in time of crisis like this.
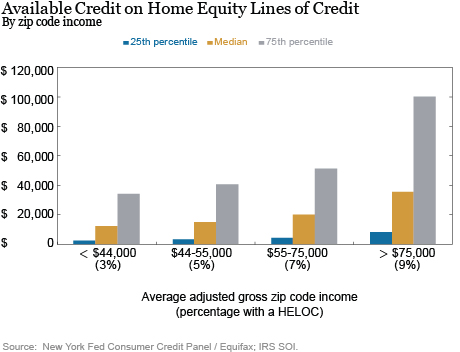
Homeowners may also have an additional option to borrow against the value of their home—and those with a home equity line of credit (HELOC) are well-positioned to draw on their home equity lines if necessary. In aggregate, the total credit on HELOCs is $912 billion, with a balance of $386 billion, leaving $577 billion available for consumption. HELOCs have been declining in prevalence since the housing boom in the early 2000s, when nearly 8 percent of borrowers had one; as of the first quarter of 2020, less than 4 percent of consumers have a HELOC they can draw on, and even then, those accounts are unevenly distributed—in the lowest income zip codes, about 3 percent of borrowers have a HELOC, compared with 9 percent in the highest income areas. Still, HELOCs provide a not insignificant potential source of cash, even for borrowers in lower income areas. In zip codes with an average annual income of less than $45,000, the median HELOC offers about $3,200, while the HELOC line at the 25th percentile offers about $2,500. But again, only 3 percent of residents in those zip codes have a HELOC at all.

In summary, we find that a substantial proportion of indebted households and individuals will potentially be able to benefit from a payment moratorium provided by the CARES Act, while a smaller share will have some ability to draw on already existing credit lines from credit cards and HELOCs. The New York Fed’s Consumer Credit Panel and the Quarterly Report on Household Debt and Credit were designed in 2009 in response to the financial crisis, when a dearth of data on consumers’ financial health presented challenges for policymakers. We will be closely tracking the state of the consumer balance sheet in the coming months, and will continue to inform policymakers and the public as new data flow in.

Andrew F. Haughwout is a senior vice president in the Federal Reserve Bank of New York’s Research and Statistics Group.

Donghoon Lee is an officer in the Bank’s Research and Statistics Group.

Joelle Scally is a senior data strategist in the Bank’s Research and Statistics Group.

Wilbert van der Klaauw is a senior vice president in the Bank’s Research and Statistics Group.
How to cite this post:
Andrew F. Haughwout, Donghoon Lee, Joelle Scally, and Wilbert van der Klaauw, “American Consumer Debt Payments and Credit Buffers on the Eve of COVID-19,” Federal Reserve Bank of New York Liberty Street Economics, May 5, 2020, https://libertystreeteconomics.newyorkfed.org/2020/05/us-debt-payments-and-credit-buffers-on-the-eve-of-covid-19.html.
Disclaimer
The views expressed in this post are those of the authors and do not necessarily reflect the position of the Federal Reserve Bank of New York or the Federal Reserve System. Any errors or omissions are the responsibility of the authors.


 RSS Feed
 Follow Liberty Street Economics