Social distancing—avoiding nonessential movement and largely staying at home—is seen as key to limiting the spread of COVID-19. To promote social distancing, over forty states imposed shelter-in-place or stay-at-home orders, closing nonessential businesses, banning large gatherings, and encouraging citizens to stay home. Over the course of the last month, virtually all of these states have reopened. However, these reopenings were preceded by a spontaneous increase in mobility and decline in social distancing. Did the reopenings decrease social distancing, or did it ratify ex post what was already going to take place? In this post, we will investigate this question using an event study methodology and demonstrate that reopenings probably have caused a large decline in social distancing, even after accounting for the trends already in place at the time of reopening.
We measure social distancing by using aggregated and anonymized data on cell phone mobility patterns collected by Unacast. Since most people carry a cell phone with them everywhere, and since the movements of cell phones can be tracked by the signals they emit, the mobility of cell phones can be computed and can serve as a reliable proxy for the mobility of people. In turn, mobility can be seen as an inverse measure of social distancing.
These data, for each U.S. state and for each week, document the percentage differential between mobility in that state in the current week and average mobility in that state over the course of February, before the COVID-19 pandemic began in the United States in earnest. These or similar measures have been used by many major media outlets to track social distancing during the COVID-19 pandemic.
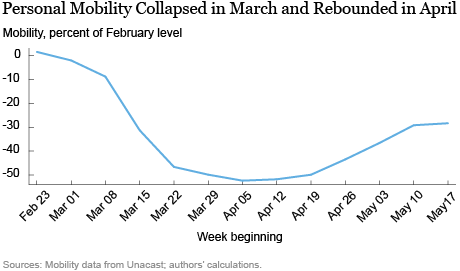
The chart below shows mobility relative to February for the United States as a whole. Up until early March, mobility was much the same as it was throughout most of February. However, starting with the week of March 15, mobility precipitously declined, reaching a nadir of about 50 percent of the February level on average and remaining at this level until mid-April, coinciding with the greatest extent of social distancing. Subsequently (and coinciding with most state reopenings) mobility rebounded (and social distancing declined) to about 65 percent of the February level on average in early-May and this trend is continuing today.

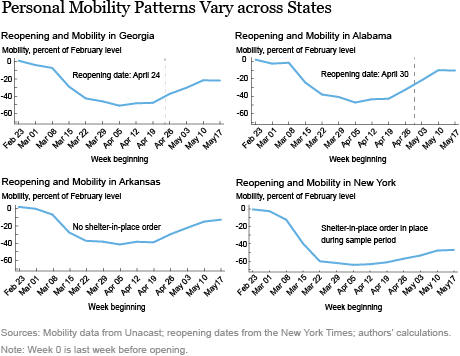
Did the state reopenings cause the decline in social distancing or did the decline in social distancing leave no choice for states but to reopen? We can find evidence from different states that is consistent with either story. The charts below show time plots of social distancing before and after reopening (or in the absence of reopening) for Georgia, Alabama, Arkansas and New York.
We see that in Georgia, mobility began to rise (and social distancing began to decline) significantly only the week after Georgia ended its stay-at-home order on April 24. On the other hand, we see that in Alabama, social distancing had been declining for two weeks before its stay-at-home order expired on April 30, so it appears that the subsequent decline in social distancing may just have been a continuation of the previous trend.
Furthermore, Arkansas never passed a stay-at-home order (and therefore, it never expired), but social distancing followed a very similar pattern to Alabama. After mobility plummeted to around 50 percent of the February level in mid-March, it began to rebound to around 65 percent of that level in late April, without any state intervention. Finally, New York did not lift its stay-at-home order during our analysis period (the order began lifting in parts of the state on May 15 and has been lifted in New York City on June 8), but mobility has also rebounded since mid-April, though not by as much as in the southern states. Looking at different states makes it difficult to disentangle whether state reopenings had an effect or just were following the wave of a decline in social distancing.

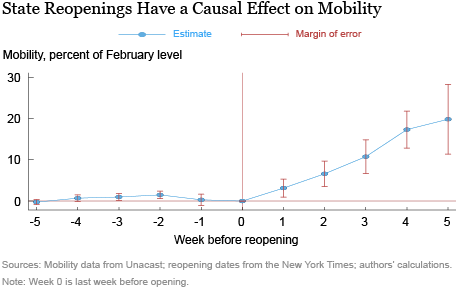
In order to look at the effect of state reopenings systematically, we perform an event study analysis. We define the week before a state reopening as week 0, the first week of reopening as week 1, the week before week 0 as week -1, and so on. Then we plot the differences in the mobility measure relative to week 0 for each state, controlling for time-invariant characteristics of states and any time-specific common events or policy changes.
If, as in the first hypothesis, state reopenings led to a decline in social distancing, then we would expect that the differences before reopening—in week -1, -2 and so on—would all be close to zero. The time path of social distancing would not be different on average for the states about to reopen from states not yet about to reopen. However, if the second hypothesis is true, and states that lifted their stay-at-home orders had mobility rising faster than the national trend, we would expect the differences before reopening to be significantly different from zero, and following a rising trend. In that case, any differences observed after reopening—in weeks 1, 2 and so on—could be the results of reopening or could just be the continuation of the rising mobility trend in states about to reopen. On the other hand, if the differences before reopening are flat at zero, then the differences (if any) after reopening likely reflect the causal effect of reopening on social distancing. The strength of the identification of this causal effect depends on the essentially random assignment of the exact date of the reopening orders across the states with respect to social distancing dynamics prior to reopening.

The chart above presents our results. Bars around each dot represent the margin of error for each difference plotted. We immediately see that our first hypothesis is right—the differences in social distancing between states about to reopen and other states are flat at zero before the actual reopenings take place. We also see that there are statistically and economically significant increases in mobility (and decreases in social distancing) after reopenings—our estimates suggest that by the 5th week after the event, reopening on average increased mobility by 20 percentage points of the pre-COVID-19 level, or from 50 percent to 65 percent of that level for a typical state.
These estimates alone do not allow us to say whether this decline in social distancing has led or will lead to a rebound in COVID-19 cases, and given the lags between infection and detection of cases, it still may be too early to say. However, what we have learned is that reopenings had a large effect on mobility. The coming weeks will inform us on the downstream effects of declining social distancing in the wake of state reopenings.
 Rajashri Chakrabarti is a senior economist in the Federal Reserve Bank of New York’s Research and Statistics Group.
 Maxim Pinkovskiy is a senior economist in the Bank’s Research and Statistics Group.
How to cite this post:
Rajashri Chakrabarti and Maxim Pinkovskiy, “Did State Reopenings Increase Social Interactions?,” Federal Reserve Bank of New York Liberty Street Economics, June 17, 2020, https://libertystreeteconomics.newyorkfed.org/2020/06/did-state-reopenings-increase-social-interactions.html.
Disclaimer
The views expressed in this post are those of the authors and do not necessarily reflect the position of the Federal Reserve Bank of New York or the Federal Reserve System. Any errors or omissions are the responsibility of the authors.


 RSS Feed
 Follow Liberty Street Economics