Aggregate reserves declined from nearly $3 trillion in August 2014 to $1.4 trillion in mid-September 2019, as the Federal Reserve normalized its balance sheet. This decline came to a halt in September 2019 when the Federal Reserve responded to turmoil in short-term money markets, with reserves fluctuating around $1.6 trillion in the early months of 2020. Then, in response to the COVID-19 pandemic, the Federal Reserve dramatically expanded its balance sheet, both directly, through outright purchases and repurchase agreements, and indirectly, as a consequence of the facilities to support market functioning and the flow of credit to the real economy. In this post, we characterize the increase in reserves between March and June 2020, describing changes to the distribution and concentration of reserves.
The Expansion of the Federal Reserve Balance Sheet
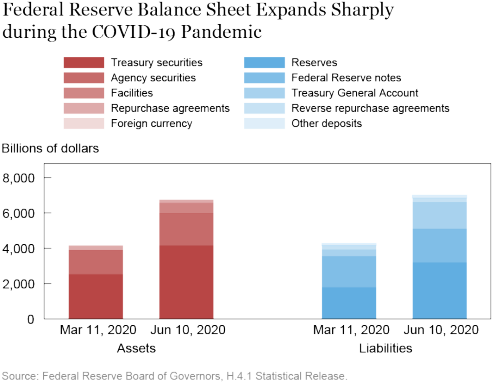
The Federal Reserve balance sheet has increased dramatically since the onset of the COVID-19 pandemic, as shown in the chart below. In response to the pandemic, the Federal Reserve expanded its holdings of Treasury securities and agency mortgage-backed securities (MBS) to support the smooth functioning of these markets, established several new lending facilities to support the flow of credit to the real economy, and expanded swap lines with other central banks to ease strains in global U.S. dollar funding markets. Assets held by the Federal Reserve increased from $4.3 trillion in March to $7.2 trillion in June. More than 70 percent of this increase comes from an expansion of the Federal Reserve’s portfolio of Treasury securities (56 percent) and agency securities (16 percent), and around 20 percent comes from the facilities put in place. The central bank swap lines account for the vast majority of the balance sheet increase arising from the facilities. As the Federal Reserve expanded its asset holdings, reserves increased.

Who Holds Reserves?
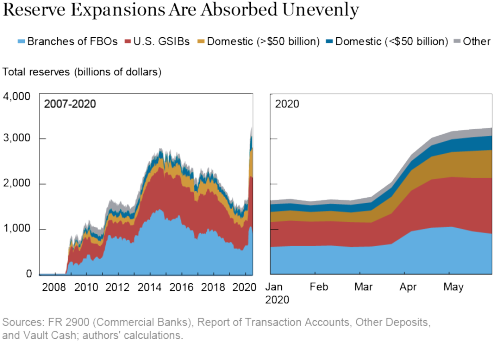
As the chart below shows, since mid-March, reserves increased by $1.5 trillion, reaching $3.2 trillion on June 10, almost half a trillion above the prior peak in August 2014. This increase was much more abrupt than the one observed in 2008, when the Federal Reserve expanded its balance sheet in response to the 2008-09 financial crisis; at that time, it took thirty-two months for reserves to increase by an amount similar to that of the last three months.

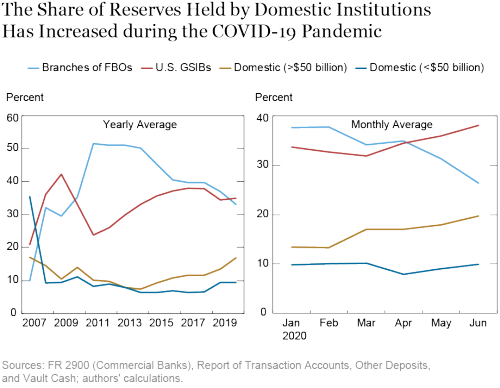
During the 2008-09 financial crisis, the increase in reserves was largely absorbed by U.S. global systemically important banks (GSIBs) and branches of foreign banking organizations (FBOs), while non-GSIB domestic institutions, especially the smaller ones, increased their holdings at a much slower pace. As a result, the share of reserves held by non-GSIB domestic institutions dropped significantly; for example, domestic institutions with less than $50 billion in assets went from being the largest holders of reserves in 2007 (35 percent) to being the smallest holders in 2008 (10 percent).
In the first two years after the crisis, the share of reserves held by GSIBs dropped, as these institutions held a relatively constant level of reserves while aggregate reserves were increasing. The share of reserves held by GSIBs then slowly rebounded over 2012-18. In contrast, branches of FBOs almost tripled their reserve balances during 2009-12 and, as the chart below shows, their share of reserves continued to increase in the aftermath of the 2008-09 financial crisis, reaching 50 percent in 2011. As the Federal Reserve began normalizing its balance sheet in 2014, GSIBs and especially branches of FBOs absorbed the bulk of the decline in reserves. In contrast, non-GSIB large domestic institutions increased their reserve balances while aggregate reserves were decreasing, thereby almost doubling their share of reserves.

The Federal Reserve increased its balance sheet again in response to the COVID-19 pandemic. As they had in 2008-09, GSIBs and branches of FBOs absorbed the majority of the increase in reserves during the initial stages of the balance sheet expansion. In contrast to the earlier episode, however, GSIBs continued to expand their reserve holdings until June, while branches of FBOs began reducing their balances in May (which led to a decline in the share of reserves held by branches of FBOs, as shown in the right panel of the chart). Moreover, unlike during the 2008-09 financial crisis, non-GSIB large domestic institutions also significantly expanded their reserve holdings, increasing their share of reserves from 13 percent to 20 percent over the last four months.
How Concentrated Are Reserves?
More than 5,000 institutions have accounts at the Federal Reserve. An intuitive way to look at the concentration of reserves is by calculating the share of reserves held by the largest reserve holders. Concentration increases as the share held by the largest entities rises.
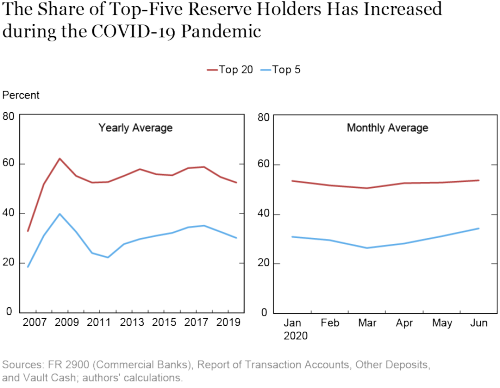
The chart below shows the share of reserves held by the top reserve holders. In 2007, the five largest reserve holders in the United States held around 20 percent of reserves. This share increased substantially in the second half of 2008, when the Federal Reserve started expanding its balance sheet in response to the 2008-09 financial crisis, and fell back to just over 20 percent in 2012, as the proportion of reserves held by GSIBs declined and the share held by branches of FBOs increased. Then, as reserves shifted from branches of FBOs to GSIBs, concentration again rose between 2013 and 2018. We have observed a similar pattern since the COVID-19 outbreak, with the share of reserves held by the five largest reserve holders increasing by almost 10 percentage points since mid-March and now exceeding 35 percent.

Conclusions
In response to the COVID-19 pandemic, the Federal Reserve has aggressively used its tools to keep markets functioning and credit flowing to the real economy. These actions have been supported by an expansion of the Federal Reserve’s balance sheet, leading to an increase in reserve balances. The increase has been absorbed mainly by GSIBs and to a lesser extent by non-GSIB large domestic institutions and branches of FBOs. As GSIBs have absorbed a larger share of the increase in reserves, the concentration of reserves has also increased.
 Gara Afonso is an assistant vice president in the Federal Reserve Bank of New York’s Research and Statistics Group.
 Marco Cipriani is an assistant vice president in the Research and Statistics Group.
 Gabriele La Spada is a senior economist in the Research and Statistics Group.
 Will Riordan is an assistant vice president in the Federal Reserve Bank of New York’s Markets Group.
How to cite this post:
Gara Afonso, Marco Cipriani, Gabriele La Spada, and Will Riordan, “A New Reserves Regime? COVID-19 and the Federal Reserve Balance Sheet,” Federal Reserve Bank of New York Liberty Street Economics, July 7, 2020, https://libertystreeteconomics.newyorkfed.org/2020/07/a-new-reserves-regime-covid-19-and-the-federal-reserve-balance-sheet.html.
Disclaimer
The views expressed in this post are those of the authors and do not necessarily reflect the position of the Federal Reserve Bank of New York or the Federal Reserve System. Any errors or omissions are the responsibility of the authors.


 RSS Feed
 Follow Liberty Street Economics