Across the United States, the cost of all types of higher education has been rising faster than overall inflation for more than two decades. Despite rising costs, aggregate undergraduate enrollment rose steadily between 2000 and 2010 before leveling off and dipping slightly to its current level. Rising college costs have steadily increased dependence on student debt for college financing, with many students and parents turning to federal and private loans to pay for higher education. An earlier post in this series reported that borrowers in majority Black areas have higher student loan balances and rates of default than those in both majority white and majority Hispanic areas. In this post, we study how differences in college attendance rates and in the types of colleges attended generate heterogeneity in loan experiences. Specifically, using nationwide data, we analyze heterogeneities in college-going and heterogeneities in student debt and default experiences by college type across individuals living in majority Black, majority Hispanic, and majority white zip codes.
Our analysis uses a nationwide data panel that links students’ educational records with their debt outcomes. We leverage a unique merger between two large datasets: the New York Fed Consumer Credit Panel (CCP) and the National Student Clearinghouse (NSC). The CCP consists of anonymized consumer credit records sourced from the Equifax credit bureau, while the NSC comprises individual-level postsecondary education records. Though the NSC currently covers 97 percent of all college enrollments, the coverage rate was less complete for cohorts that attended college before the mid-1990s. We therefore focus our analysis on individuals in our CCP-NSC data set that were born between 1980 and 1984, both to maximize coverage and ensure that we can observe debt outcomes for each individual up to age 30.
We classify individuals’ locations according to their zip code reported on credit records at age 30. Then, using American Community Survey (ACS) data for 2012-16, we classify each zip code as majority Black, majority Hispanic, or majority white. We define majority Black zip codes as those where non-Hispanic Black individuals make up at least 50 percent of the adult population. Likewise, a majority Hispanic zip code is defined as one in which more than half of adult residents are Hispanic and a majority white zip code is defined as one in which more than half of adult residents are non-Hispanic white. We categorize college type by the highest level of institution (two-year or four-year) attended by each individual.
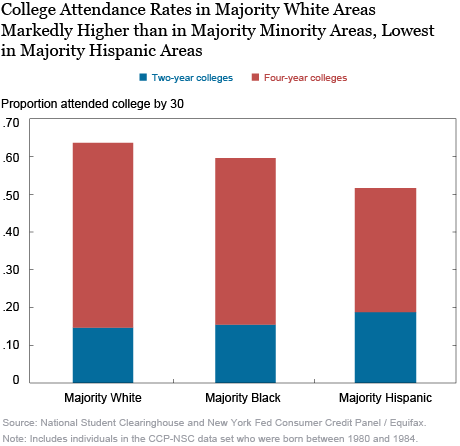
We first focus our analysis on college attendance behavior, noting stark differences between majority Black, majority Hispanic, and majority white zip codes. In the chart below, we find that individuals from majority white zip codes have the highest college attendance rate, followed by individuals from majority Black zip codes. Individuals in majority Hispanic zip codes have the lowest attendance rates among these three zip code categories. In majority white zip codes, 64 percent of 30-year-olds with a credit report had attended some kind of post-secondary education; of that total, 15 percent had attended a two-year institution and 49 percent had attended a four-year institution. Individuals in majority Hispanic zip codes attended two-year colleges at a marginally higher rate, and those in both majority Black and majority Hispanic areas lagged behind those in majority white zip codes in four-year college attendance. While the majority Hispanic areas have a higher two-year college attendance rate, their lower overall rate of college-going is explained by a considerably lower attendance rate for four-year colleges. Individuals in majority Black areas are 15 percentage points more likely to go to a four-year college than individuals in majority Hispanic areas.
In results not shown, we apply the same analysis to people living in the nation’s largest metropolitan areas. New York-area residents attend two-year colleges less frequently, and four-year colleges more frequently, than the national averages for each zip code category. New York City has a massive public university system with several four-year campuses, which may help explain area residents’ propensity for pursuing four-year degrees over two-year ones. Los Angeles lags only marginally behind New York in four-year attendance rates in majority white areas, but lags significantly behind New York in this rate for majority Hispanic and majority Black areas. However, Los Angeles has a much higher two-year college attendance rate than New York in each zip code category.

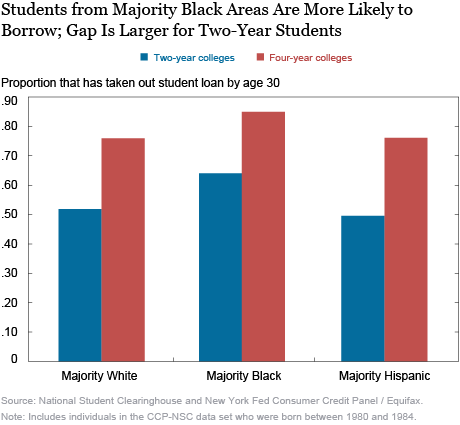
There is significant variation in student loan behavior by race and ethnicity. Individuals who attended college and live in majority Black neighborhoods are more likely to borrow than those in majority white areas and majority Hispanic areas. Four-year attendees in majority Black neighborhoods were 9 percent more likely to have a student loan by age 30 than their counterparts in majority white and majority Hispanic areas. We find that the propensity to hold student debt is similar between majority white and majority Hispanic areas, for both two-year and four-year college attendees, with two-year attendees in majority Hispanic areas borrowing at slightly lower rates.

We also examine student debt balances among those who hold student loans. Borrowers in majority Hispanic zip codes carry similar debt balances at age 30 to those in majority white zip codes, among four-year college students. Among two-year students, students from majority Hispanic zip codes hold lower balances than those from majority white neighborhoods. However, four-year borrowers typically have a much higher debt balance at age 30 than two-year attendees, reflecting the relative costs of these colleges. Moreover, consistent with the findings of an earlier post in this series, we find that borrowers in majority Black areas carry higher debt balances than borrowers in majority Hispanic zip codes. Differentiating between two-year and four-year college borrowers, we find this gap between majority Black and majority Hispanic areas to be present for both college types. But interestingly, this gap is much more prominent for two-year borrowers. Borrowers from two-year colleges in majority Black neighborhoods hold 45 percent higher balances at age 30 than borrowers from two-year colleges in majority Hispanic areas. This number is 23 percent for four-year college borrowers.
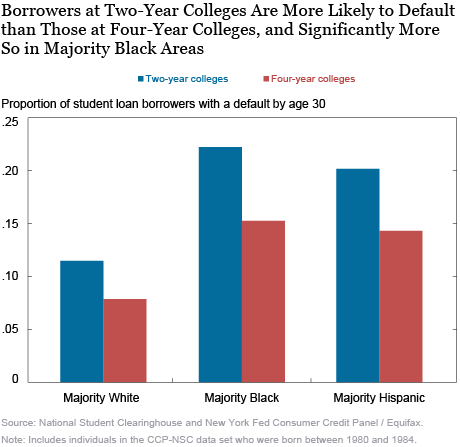
Lastly, we examine student debt default and find significant differences across school type, geography, and demographics. Borrowers who attend two-year colleges have uniformly higher default rates by age 30. As shown earlier, two-year attendees are less likely to borrow, but here we see that the debt they take on is riskier. The default patterns for two-year and four-year attendees are starkly different: nationwide, borrowers who went to two-year schools default almost 50 percent more often than their four-year counterparts in majority Black, majority Hispanic, and majority white areas alike.
Overall, borrowers living in majority Black and majority Hispanic zip codes are much more likely to default on student debt by age 30. Two-year college borrowers in majority Black areas default at 1.9 times the rate of those in majority white areas, and those in majority Hispanic areas default 1.7 times as often as residents in majority white areas. The ratios of default rates among four-year borrowers are very similar. Nationwide default rates are highest for those living in majority Black zip codes and just 1-2 percentage points lower for individuals living in majority Hispanic areas, both for two-year and four-year borrowers.

This post reveals that headline statistics paint a far from complete picture of college attendance, student debt, and default rate trends, which vary considerably across demographic groups. While individuals in majority Black and majority Hispanic areas have lower college attendance rates than those in majority white areas (a reflection of significantly lower four-year college attendance rates), students from majority Black areas have a markedly higher propensity to take out student loans and students from majority Black and majority Hispanic areas have a considerably higher propensity to default on those debts. We also find that two-year college students are less likely to borrow but more likely to default, conditional on borrowing. These disparities in debt and default patterns are stark and it is important to better understand the underlying reasons for these differences—a challenge we will take on in future work.

Rajashri Chakrabarti is a senior economist in the Federal Reserve Bank of New York’s Research and Statistics Group.
 William Nober is a senior research analyst in the Bank’s Research and Statistics Group.
 Wilbert van der Klaauw is a senior vice president in the Bank’s Research and Statistics Group.
How to cite this post:
Rajashri Chakrabarti, William Nober, and Wilbert van der Klaauw, “Measuring Racial Disparities in Higher Education and Student Debt Outcomes,” Federal Reserve Bank of New York Liberty Street Economics, July 8, 2020, https://libertystreeteconomics.newyorkfed.org/2020/07/measuring-racial-disparities-in-higher-education-and-student-debt-outcomes.html.
Disclaimer
The views expressed in this post are those of the authors and do not necessarily reflect the position of the Federal Reserve Bank of New York or the Federal Reserve System. Any errors or omissions are the responsibility of the authors.


 RSS Feed
 Follow Liberty Street Economics