Editor’s note: When this post was first published, a reference in the penultimate paragraph to the “elderly” was incorrect; the reference has been corrected to the “near-elderly.” (September 17, 2020, 11:10 a.m.)
Consumer financial strain varies enormously across the United States. One pernicious source of financial strain is debt in collections—debt that is more than 120 days past due and that has been sold to a collections agency. In Massachusetts, the average person has less than $100 in collections debt, while in Texas, the average person has more than $300. In this post, we discuss our recent staff report that exploits the fact that virtually all Americans are universally covered by Medicare at 65 to show that health insurance not only improves financial health on average, but also is a major explanation for the heterogeneity in financial strain across the country. We find that Medicare affects different parts of the United States differently and plays a particularly important role in improving financial health in the least advantaged areas.
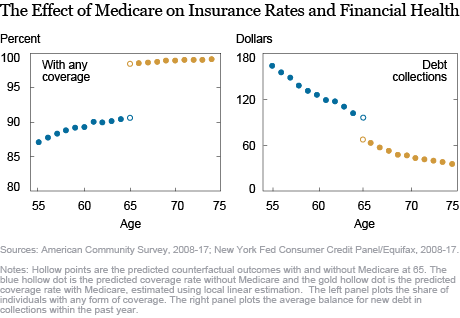
People make many lifestyle changes in their 60s—they typically retire, downsize, decrease consumption and earnings, move in with children, or lose family members—and these transformations happen relatively continuously as they age. In contrast, most people qualify for Medicare precisely at 65, not a year earlier or later. In the chart below, we plot the average insurance rate and amount of debt in collections for every age from 55 to 75, using data on collections amounts from the New York Fed Consumer Credit Panel.
Although people tend to be more likely to have insurance and, on average, have lower debt balances in collections as they age, these trends evolve continuously as people grow older. The exception happens at 65—that is when the insurance rate jumps by 8 percentage points from around 92 percent to nearly 100 percent, while the average amount in collections falls by nearly 30 percent of the average balance in collections at age 64. This is accounted for by both fewer people having debt in collections, and people having smaller balances in collections than they otherwise would have had.
Because nothing else changes so abruptly at age 65 as does eligibility for Medicare—even Social Security receipt rises smoothly, though rapidly, through the early and mid-60s—it is reasonable to conclude that having access to Medicare materially improves people’s financial health along this critical margin. These findings are also consistent with research by Barcellos and Jacobson, which shows that contact by collection agencies and difficulties with medical bills also decline discretely at 65.

The recognition that Medicare improves financial health on average is well-known in the literature. Here we investigate the heterogeneity of the Medicare effect across the country by performing the discontinuity exercise above for each of the 741 U.S. commuting zones (groups of counties within which people tend to commute for work, such as the NYC metro area). We reach three intriguing conclusions.
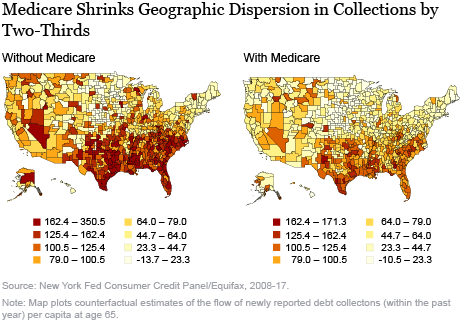
First, Medicare reduces the gap in debt collections between areas of the United States, like the Massachusetts and Texas example above, by two-thirds at age 65. Just like we did nationwide, we can estimate average dollar amounts in collections at every age for every commuting zone and plot them as we did in the above chart. By extrapolating the continuous trend below age 65 for every geographic location, we can estimate what the total amount in collections would have been at 65 if Medicare did not exist. We can then compare these amounts with the actual amounts in collections that we see under Medicare.
The figure below presents two maps of the actual and counterfactual amounts in collections for 65-year-olds across U.S. commuting zones. We see that not only are collections amounts lower in the map showing actual conditions (with Medicare) than in the counterfactual map, but they are much more similarly distributed across the country. The right panel illustrates that the South is much less of an outlier in terms of high amounts in collections relative to the rest of the country, while the Midwest is barely distinguishable from the Northeast and Plains regions. Quantifying the variation across commuting zones in both maps, we find that Medicare reduces geographic variation in amounts in collection by approximately two-thirds.

Second, we show that the financial health benefits of Medicare are distributed in a way that reaches poor and vulnerable areas. Since we can compute the decline in collections amounts for every one of the 741 U.S. commuting zones, we can ask which characteristics of commuting zones statistically explain the size of the benefit of Medicare per newly-insured individual (the ratio of the decline in collections amounts to the increase in uninsurance relative to their counterfactual at 65). The variables that are most robustly associated with the decline in collections per newly insured are: the fraction of residents in the commuting zone who are Black, the fraction of residents with disabilities and the market share of for-profit hospitals (which tend to provide less charity care than do nonprofits). All of these characteristics are particularly high in commuting zones in the South, which also tend to be less affluent than the national average.
Third, we construct forecasts of the causal effect of expanding coverage to the near-elderly in each commuting zone in the United States, which we use to evaluate existing policies and can serve as a guide for future expansions. This is straightforward to do with our methodology as we can extrapolate collections amounts for individuals 65 and older to compute counterfactual estimates of what amounts in collections would be for individuals aged 64 if they had access to Medicare. (For this exercise we assume that there is no selective migration at 65 from one commuting zone to another; accounting for this migration would likely increase the magnitude and dispersion of the benefits of Medicare for financial strain).
Two questions stand out based on these forecasts. First, would the additional beneficiaries of coverage expansion to the near-elderly also reside in disadvantaged areas? Second, would there be benefits following the introduction of much higher insurance coverage following the passage of the Patient Protection and Affordable Care Act (ACA) in 2014?
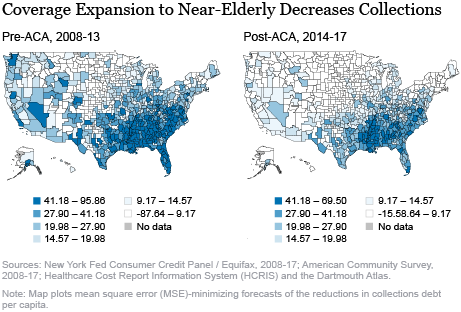
The figure below shows two maps of the geographic distribution of the reduction in amounts in collections that would take place if Medicare were expanded to the near-elderly: one assuming insurance rates as prevailed before the implementation of the ACA and one assuming post-ACA insurance rates. We find that not only does Medicare already give large benefits to minority and vulnerable areas, but an expansion of coverage to the near-elderly, along the lines of Medicare, would have the same effects.
The declines in collections amounts in both maps are largest in the same counties in the South that are already among the largest beneficiaries of Medicare. We see that the ACA attenuates the overall benefits of expanding coverage to the near-elderly, as after the ACA most near-elderly have obtained insurance either through the Medicaid expansion or the new health insurance exchanges. However, even after the ACA, the geographic pattern of the financial benefits of coverage expansion to the near-elderly remains such that it would further reduce the geographic dispersion in financial health. In fact, our staff report finds that although a Medicare-style coverage expansion to the near-elderly improves financial health in areas with generally high financial strain to begin with, the ACA’s improvements in financial health—while substantial—were larger in places where it was high in the first place.

Our research highlights the heterogeneity in financial strain across the United States and the leading role of health insurance in explaining it. We likewise show that even national and universal programs like Medicare have very different impacts on different parts of the country. Understanding the geographical variation in the impacts of different interventions is essential to crafting policies that reach the people that policymakers most intend to help.
Paul Goldsmith-Pinkham is an assistant professor of finance at the Yale School of Management.

Maxim Pinkovskiy is a senior economist in the Federal Reserve Bank of New York’s Research and Statistics Group.
Jacob Wallace is an assistant professor at the Yale School of Public Health.
How to cite this post:
Paul Goldsmith-Pinkham, Maxim Pinkovskiy, and Jacob Wallace, “Medicare and Financial Health across the United States,” Federal Reserve Bank of New York Liberty Street Economics, July 8, 2020, https://libertystreeteconomics.newyorkfed.org/2020/07/medicare-and-financial-health-across-the-united-states.html.
Disclaimer
The views expressed in this post are those of the authors and do not necessarily reflect the position of the Federal Reserve Bank of New York or the Federal Reserve System. Any errors or omissions are the responsibility of the authors.


 RSS Feed
 Follow Liberty Street Economics