More than two million American households are at risk of eviction every year. Evictions have been found to cause prolonged homelessness, worsened health conditions, and lack of credit access. During the COVID-19 outbreak, governments at all levels implemented eviction moratoriums to keep renters in their homes. As these moratoriums and enhanced income supports for unemployed workers come to an end, the possibility of a wave of evictions in the second half of the year is drawing increased attention. Despite the importance of evictions and related policies, very few economic studies have been done on this topic. With the exception of the Milwaukee Area Renters Study, evictions are rarely measured in economic surveys. To fill this gap, we conducted a novel national survey on evictions within the Housing Module of the Survey of Consumer Expectations (SCE) in 2019 and 2020. This post describes our findings.
Our survey evidence complements recent studies based on administrative court data in two ways. First, evictions can happen outside of the court system. Some evidence even suggests that more than half of evictions are informal, without being ordered by a court. Second, within a survey, we can elicit reasons for evictions—for example, loss of income, as opposed to divorce or sale of a property by the landlord—to shed light on the events leading up to evictions.
Our eviction survey module consists of the following questions. First, to encourage truthful reporting by respondents with an eviction history, we ask all respondents whether they know someone who has been evicted since 2006. Then, respondents are asked whether they themselves have been evicted in the past, and if so, the year of eviction. Finally, we elicit reasons for eviction by offering respondents nine predefined options, such as “health issues/medical bills” and “increase in monthly rent or utility costs,” as well as the ability to type in their own reasons if theirs is not covered by the options provided. After merging these survey responses with a rich set of demographics and other outcomes collected from the SCE, we examine the links between eviction, income, homeownership status, and credit access.
Eviction Rate and Income
Our analysis finds that evictions are relatively common in the United States. More than 24 percent of households know someone who has been evicted and about 4 percent of households have been evicted themselves. These rates are substantially higher for current renters, with 37 percent knowing someone evicted since 2006 and 9 percent having an eviction history. For homeowners, these shares are 21 percent and 2 percent, respectively. Our eviction rate is slightly lower than that of a previous study based on the Milwaukee Area Renters Study, which showed that one in eight renters in Milwaukee were evicted between 2009 and 2011. The different eviction rates can potentially be attributed to the differences between samples (national versus local) and different survey years.
Eviction is related to household income in a highly nonlinear way, as shown in the chart below. About 73 percent of the households who have been evicted before have a current income under $50,000. For income bins above $50,000, the eviction rate is always under 3 percent, and gradually declines as income rises. The percentage of households knowing someone who has been evicted is highly correlated with the share of households who have been evicted themselves.
Causes of Eviction
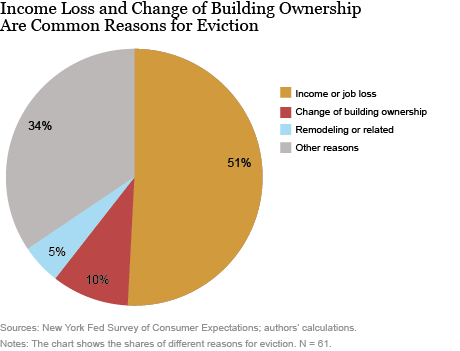
Turning to reasons for eviction, the next chart shows that slightly more than half of respondents with an eviction history selected “job loss/ unemployment,” “reduction in income,” or both as reasons for their eviction, making income or job loss the most prevalent reason.
Besides income loss, about 15 percent of the evictions were driven by property sales, remodeling, or landlords changing the property to a primary residence for themselves. In fact, for households that did not suffer an income loss, sale of the property by the landlord was the most common driver of evictions. (Note that we did not offer these “no‑fault” reasons as options for respondents to choose from, meaning that our survey participants entered them in the “Other” category. This design makes it unlikely that respondents untruthfully used these reasons for their eviction.) Taken together, a meaningful fraction of evictions is no‑fault. Such results motivate recent state and local policies requiring “good cause” for evictions.

Homeownership among Evicted Households
We next study homeownership for households with an eviction history. We find that households with an eviction history are much less likely to be homeowners than other households, with a homeownership rate of 35 percent (regardless of whether their evictions were at-fault or no-fault), compared to an average of 74 percent for our full sample. Put another way, however, this means that more than one-third of households with past evictions are homeowners, suggesting that many evicted households subsequently overcome challenges and become homeowners.
Credit Access for Evicted Households
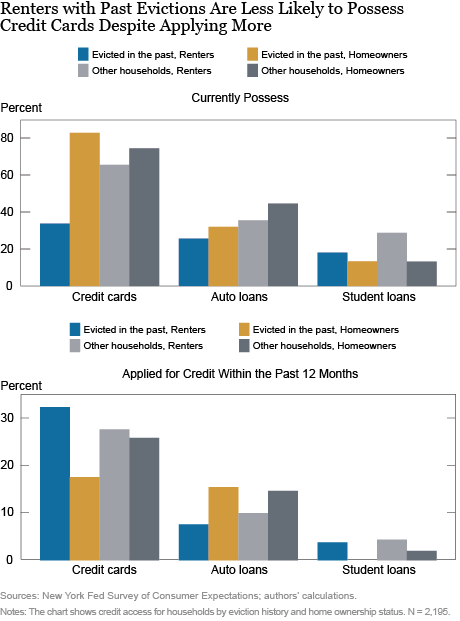
The next chart presents credit-access results for households, broken down by eviction history and homeownership status.
We can see that among current renters, those with past evictions are less likely to have access to credit cards and auto loans, consistent with previous work showing that eviction negatively affects credit access and consumption for several years. The bottom panel shows that renters with past evictions are more likely than other renters to have applied for credit cards in the past twelve months. Therefore, despite applying more often for credit cards, renters with past evictions are less likely to have them. This suggests that considering only whether renters have credit cards could understate the impact of evictions on credit supply to renters. Looking at student loans, we see that for current renters, there is no significant relationship between access to student loans and eviction history, potentially because student loans are generally not underwritten.
Turning to homeowners, we see no substantial differences in credit access—for credit cards, auto loans, or student loans—between those with and without an eviction history, suggesting that once an evicted household becomes homeowners, they enjoy access to credit similar to that of other households.
One final note of interest is that when we compare respondents who experienced a no-fault eviction with those who were evicted for income-related reasons, we don’t get a clear message about whether it is eviction or income instability that causes outcomes such as constrained credit access. A tentative read of the data suggests that eviction itself serves as an impediment to credit access and home ownership for those who remain renters. However, a significant share of no-fault evictees achieve homeownership and enjoy high current incomes.

Eviction and Race
Our survey provides some evidence that evictions are concentrated in minority communities. Minority respondents are more likely to report that they have been evicted in the past, although this result becomes statistically insignificant when we account for income and education levels. But minority respondents are 8 percentage points more likely to report knowing someone who has been evicted, a statistically significant result even when we account for income and other demographics.
Conclusion
In summary, based on a novel survey, we find that evictions are fairly common in the United States, with about 9 percent of renters having at least one past eviction. Income loss is the most important cause of eviction, followed by property sales, remodeling, or conversion of the property to a primary residence, with the latter three drivers highlighting the importance of protecting renters from no-fault evictions. We also find that evictions are linked to reduced credit access. Despite these challenges, one-third of evicted households subsequently become homeowners.

Andrew Haughwout is a senior vice president in the Federal Reserve Bank of New York’s Research and Statistics Group.

Haoyang Liu is an economist in the Bank’s Research and Statistics Group
Xiaohan Zhang is an assistant professor at California State University‑Los Angeles.
How to cite this post:
Andrew Haughwout, Haoyang Liu, and Xiaohan Zhang, “Who Has Been Evicted and Why?,” Federal Reserve Bank of New York Liberty Street Economics, July 8, 2020, 2020, https://libertystreeteconomics.newyorkfed.org/2020/07/who-has-been-evicted-and-why.html.
Disclaimer
The views expressed in this post are those of the authors and do not necessarily reflect the position of the Federal Reserve Bank of New York or the Federal Reserve System. Any errors or omissions are the responsibility of the authors.


 RSS Feed
 Follow Liberty Street Economics